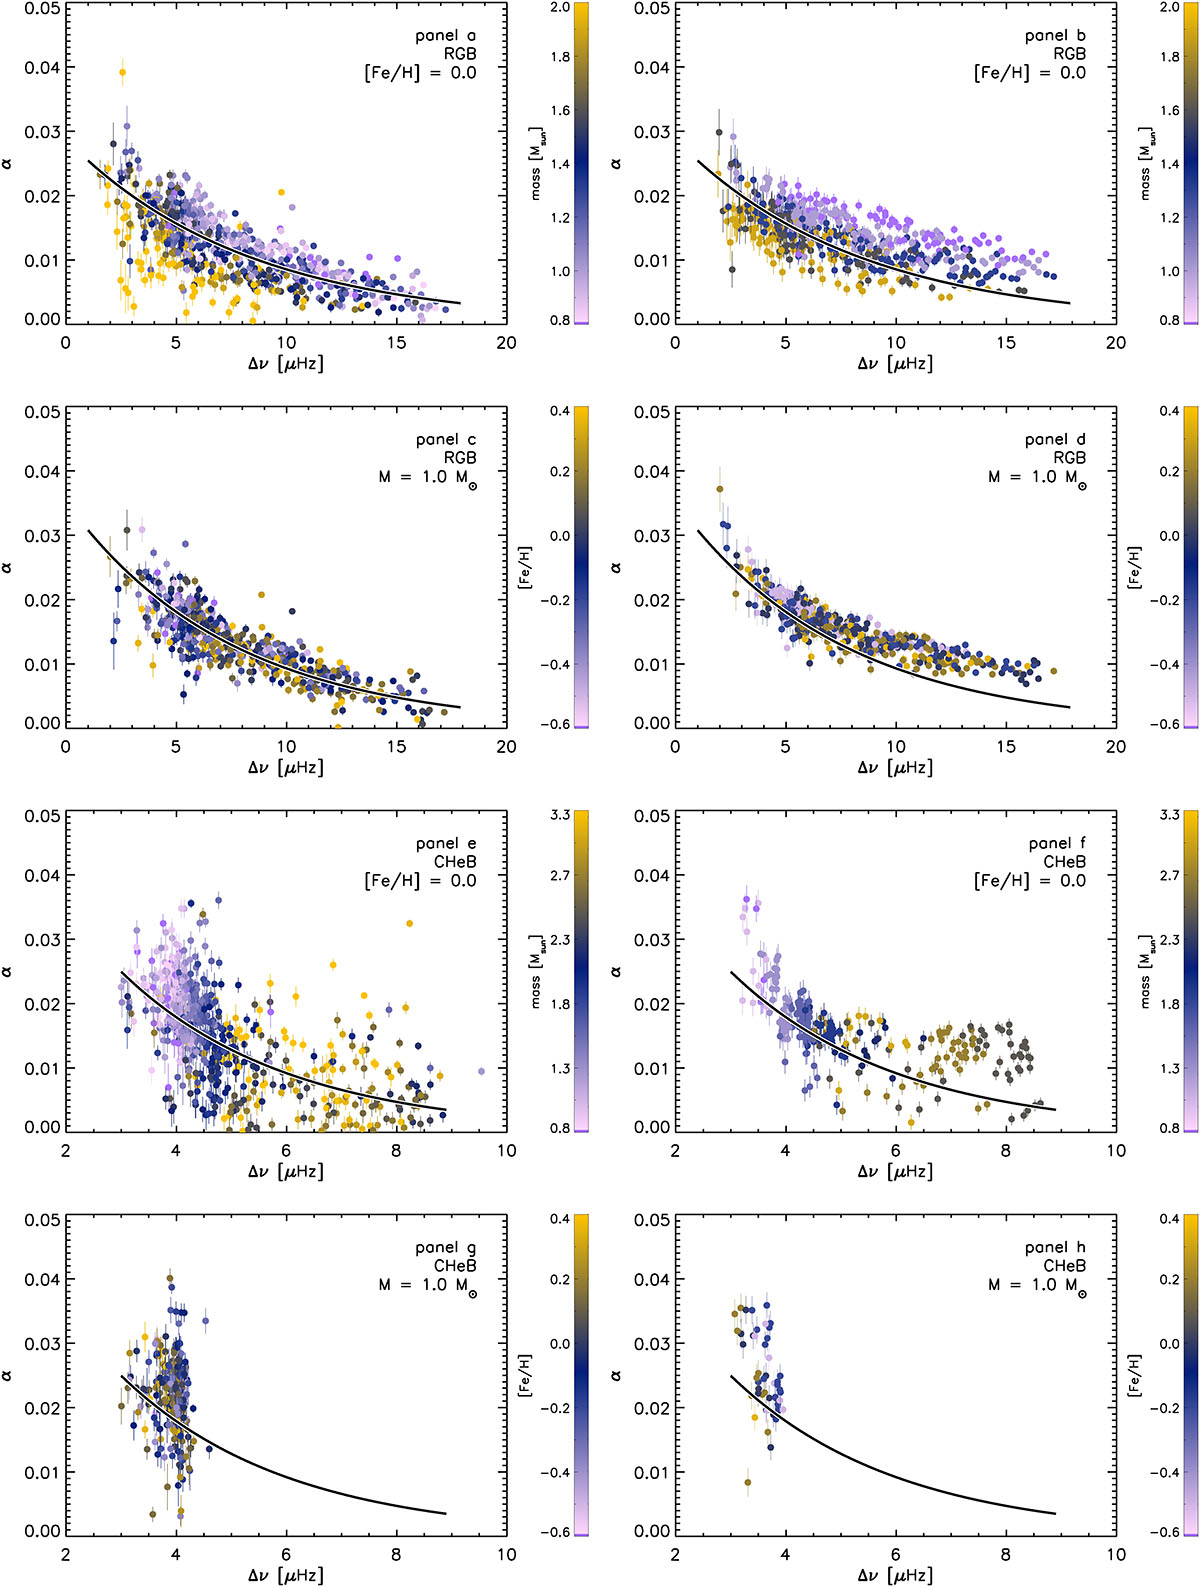
Fig. 6.
Download original image
Curvature (α) as a function of the large frequency separation (Δν) for observations (left) and models (right), split for RGB stars (panels a–d) and CHeB stars (panels e–h), colour-coded by mass (panels a–b and e–f) and metallicity (panels c–d and g–h). The colour code is the same for both the observations and the models. The black lines indicate the RGB and CHeB fits from Fig. 2 and Eq. (7), with the coefficients from Table 1, except for panels c and d, where we use a fit through the selected observed values to account for the dependence of α on mass.
Current usage metrics show cumulative count of Article Views (full-text article views including HTML views, PDF and ePub downloads, according to the available data) and Abstracts Views on Vision4Press platform.
Data correspond to usage on the plateform after 2015. The current usage metrics is available 48-96 hours after online publication and is updated daily on week days.
Initial download of the metrics may take a while.