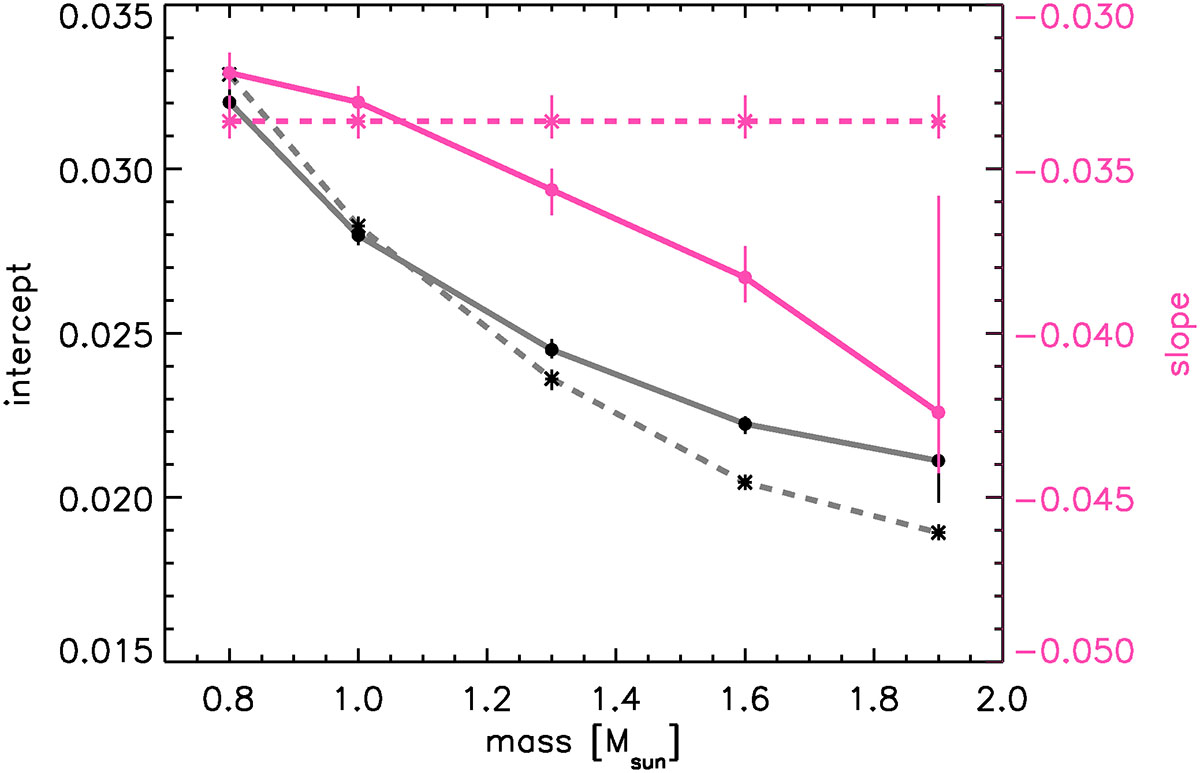
Fig. 5.
Download original image
Intercepts (dark grey, left axis) and slopes (pink, right axis) of linear fits in log α versus Δν for RGB models as a function of mass. The points show the mean slope and intercept of fits for 1000 perturbations in which we perturbed both νmax and the individual frequencies within their uncertainties. The vertical bars indicate the spread in the results of these 1000 perturbations. The points connected by a solid line show the results of fits in which both the slope and the intercept were free parameters. The dashed lines connect points for fits with a fixed slope. See text for more details and Fig. C.1 for the fits to the different masses.
Current usage metrics show cumulative count of Article Views (full-text article views including HTML views, PDF and ePub downloads, according to the available data) and Abstracts Views on Vision4Press platform.
Data correspond to usage on the plateform after 2015. The current usage metrics is available 48-96 hours after online publication and is updated daily on week days.
Initial download of the metrics may take a while.