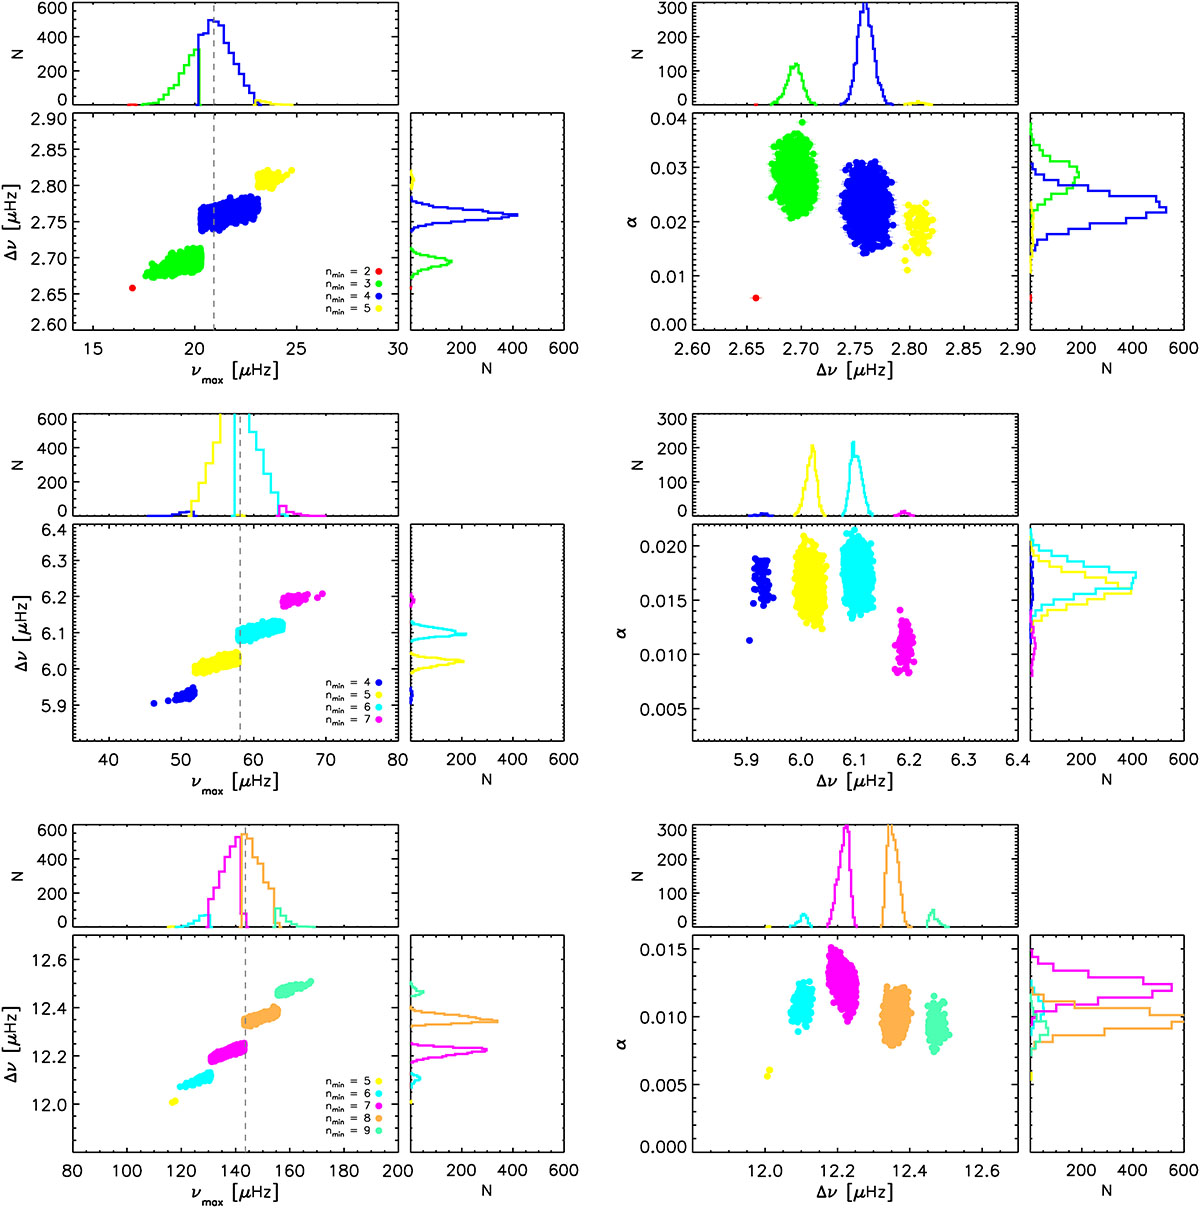
Fig. B.1.
Download original image
For three models of one solar mass and solar metallicity, the results of Δν versus νmax (left) and α versus Δν (right) for 5000 perturbations of 5% uncertainty in νmax and the individual frequencies. The different colours indicate different sets of modes (see legend where the n value of the lowest frequency mode of the set is indicated) that are selected to be the ones closest to the perturbed νmax value. The vertical gray dashed line indicates the nominal value of νmax of the respective model. Histograms of the parameters are shown in the top and right panels, respectively, with the same colour code as the main panels.
Current usage metrics show cumulative count of Article Views (full-text article views including HTML views, PDF and ePub downloads, according to the available data) and Abstracts Views on Vision4Press platform.
Data correspond to usage on the plateform after 2015. The current usage metrics is available 48-96 hours after online publication and is updated daily on week days.
Initial download of the metrics may take a while.