Open Access
Fig. A.1.
Download original image
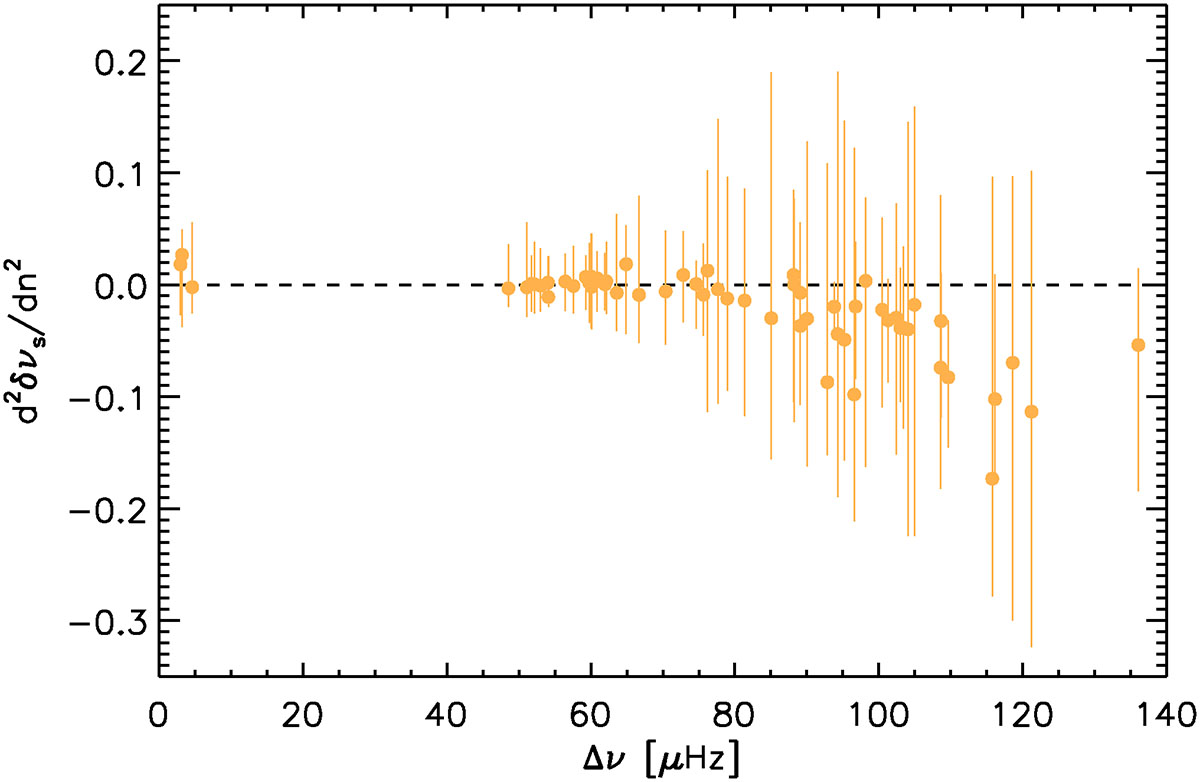
Value of d2δνs/dn2 per star as a function of Δν. The solid dots indicate the median value, and the vertical lines the spread of d2δνs/dn2 as a function of frequency.
Current usage metrics show cumulative count of Article Views (full-text article views including HTML views, PDF and ePub downloads, according to the available data) and Abstracts Views on Vision4Press platform.
Data correspond to usage on the plateform after 2015. The current usage metrics is available 48-96 hours after online publication and is updated daily on week days.
Initial download of the metrics may take a while.