| Issue |
A&A
Volume 709, May 2026
|
|
|---|---|---|
| Article Number | A238 | |
| Number of page(s) | 11 | |
| Section | Extragalactic astronomy | |
| DOI | https://doi.org/10.1051/0004-6361/202557080 | |
| Published online | 19 May 2026 | |
Baryonic Ecosystem IN Galaxies (BEINGMgII)
III. Cool gas reservoirs at 0.3 ≤ z ≤ 1.6 in the Dark Energy Survey
1
Indian Institute of Astrophysics (IIA), Koramangala, Bangalore, 560034, India
2
Pondicherry University, R.V. Nagar, Kalapet, Puducherry, 605014, India
3
Università degli Studi di Milano-Bicocca, Dip. di Fisica G. Occhialini, Piazza della Scienza 3, 20126, Milano, Italy
4
INAF – Osservatorio Astronomico di Trieste, Via G.B. Tiepolo 11, I-34143, Trieste, Italy
5
Centre for Astrophysics and Supercomputing, Swinburne University of Technology, Hawthorn, VIC, 3122, Australia
6
INAF – Osservatorio Astronomico di Brera, Via Brera 28, 21021, Milano, Italy
7
European Southern Observatory, Karl-Schwarzschildstrasse 2, D-85748, Garching bei Munchen, Germany
8
Aix Marseille Université, CNRS, LAM (Laboratoire d’Astrophysique de Marseille) UMR 7326, F-13388, Marseille, France
9
Kavli Institute for Astronomy and Astrophysics, Peking University, Beijing, 100871, PR China
10
Department of Astronomy, School of Physics, Peking University, Beijing, 100871, PR China
★ Corresponding author: This email address is being protected from spambots. You need JavaScript enabled to view it.
Received:
2
September
2025
Accepted:
22
January
2026
Abstract
We investigate the origin of intervening cool Mg II absorption detected in the spectra of background quasars and the nature of associated galaxies across a broad redshift range of 0.3 ≤ z ≤ 1.6, and a largely unexplored galactrocentric distance of ≲20 kpc. Using nebular [O II] λλ3727, 3729 emission lines identified in DESI fibre spectra centred on quasars, we detect 342 galaxies at a typical detection rate of ∼0.45% at z ≲ 1, which increases with the Mg II equivalent width (W2796). A significant fraction (74%) of these galaxies are associated with strong absorbers with W2796 ≥ 2 Å. These absorbers trace galaxies spanning stellar masses of 8.4 ≤ log(M★/M⊙)≤11.6 and star formation rates (SFRs) of −1 ≤ log(SFR [M⊙ yr−1]) ≤ 2.7, located at projected galactocentric distances of 4−24 kpc. We find that the average Mg II absorber strength increases from 2.1 Å to 2.8 Å between redshifts of z ∼ 0.4 and 1.2, indicating evolution in the cool gas content of galaxy halos. The relatively constant absorber strength with galactocentric distance implies a clumpy structure of cool gas in the circumgalactic medium (CGM). Further, we find a positive correlation between W2796 versus stellar mass (M★), and the SFR, suggesting that the distribution of metal-enriched cool gas in the CGM is closely tied to the properties of the host galaxies. The redshift evolution of gas-phase metallicity suggests that strong Mg II absorbers trace the general population of star-forming galaxies. The velocity dispersion of the cool gas increases with halo mass, and the wide range of the line-of-sight velocity offset (−389 to 364 km s−1) between the galaxy systemic velocity and absorbers highlights the dynamical nature of CGM. However, the majority of this gas remains gravitationally bound to the dark matter halos, consistent with a picture of gas recycling via galactic fountains.
Key words: galaxies: evolution / galaxies: formation / galaxies: high-redshift / galaxies: ISM / quasars: absorption lines / galaxies: star formation
© The Authors 2026
 Open Access article, published by EDP Sciences, under the terms of the Creative Commons Attribution License (https://creativecommons.org/licenses/by/4.0), which permits unrestricted use, distribution, and reproduction in any medium, provided the original work is properly cited.
This article is published in open access under the Subscribe to Open model. This email address is being protected from spambots. You need JavaScript enabled to view it. to support open access publication.
1. Introduction
Galaxies across the wide spectrum of stellar mass and morphologies, including actively star-forming and quiescent galaxies, harbour cool gas reservoirs within their halo (Chen et al. 2010; Nielsen et al. 2013; Huang et al. 2021; Chen et al. 2025). This metal-rich cool gas extending up to the virial radius is believed to originate in galactic winds driven by active galactic nucleus (AGN) feedback or supernova explosions (Rahmati et al. 2015; Schroetter et al. 2019; Ho et al. 2021; Huscher et al. 2021; Zabl et al. 2021; Schroetter et al. 2024). The supernova-driven outflow models require high-energy coupling from the supernovae to the gas, and with supernova efficiencies of nearly unity in transferring energy to the wind (Afruni et al. 2021). Furthermore, the continuous accretion of pristine gas from the intergalactic medium replenishes the gas reservoir, the circumgalactic medium (CGM), which is fundamental for maintaining the galaxy growth (Tumlinson et al. 2017). However, tracing this low-density gas has remained challenging (Péroux et al. 2020; Peroux & Nelson 2024).
The Mg II absorption in the background quasar spectra gives access to the cool photoionized gas of temperature ≃104 K and high neutral hydrogen column density of log N(H I) [cm−2] ∼ 18−22 (Tumlinson et al. 2017; Péroux et al. 2020). The studies based on absorber-galaxy connection show that Mg II absorbers are a generic feature near ordinary galaxies, largely tracing the underlying gas kinematics around them, including: inflowing and outflowing gas (Bouché et al. 2007; Nestor et al. 2011; Ho et al. 2017; Lan & Mo 2018; Zabl et al. 2021; Guo et al. 2023; Bacon et al. 2023; Nateghi et al. 2024; Kacprzak et al. 2025); the multiple halos of a galaxy group (Kacprzak et al. 2010; Bielby et al. 2017; Péroux et al. 2017; Nielsen et al. 2018; Fossati et al. 2019; Dutta et al. 2020; Lundgren et al. 2021; Fernández-Figueroa et al. 2024); the intra-group medium (Gauthier 2013); and/or cool stripped gas from environmental processes (Dutta et al. 2020; Anand et al. 2022; Mishra & Muzahid 2022). The statistical analysis of millions of quasar-galaxy pairs revealed an excess mean Mg II absorption extending on a spatial scale of 20 kpc to 10 Mpc, with an excess around emission line galaxies (ELGs) compared to luminous red galaxies (Lan & Mo 2018; Wu et al. 2025; Chen et al. 2025; Anand et al. 2021). The studies based on cosmological hydrodynamic zoom-in simulations further highlight that the CGM around L* star-forming galaxies has experienced substantial evolution in both its physical structure and dynamical state from the present epoch until cosmic noon, i.e. z ∼ 2 − 3 (Huscher et al. 2021). The signature of cool gas evolution is further supported by the stronger Mg II absorption in the halos of high-z galaxies than in the ones of their low-z counterparts (Wu et al. 2025). On the contrary, Chen (2012) found a similar spatial extent and mean absorption equivalent width in the CGM at low and high redshifts across the 11 Gyr (see also, Rudie et al. 2019).
The strong interplay between galaxy and CGM is further highlighted by the observed increase in absorption strength with the SFR and stellar mass of absorber host galaxies, supporting the galactic wind origin of Mg II gas (Bouché et al. 2007; Zibetti et al. 2007; Bouché et al. 2012; Zabl et al. 2019; Schroetter et al. 2019). Mapping the disc–halo interface within ≲50 kpc, where gas accretion and outflows are more pronounced, offers a pathway to understand how the physical state of the CGM regulates feedback, accretion, and long-term galaxy growth (Bouché et al. 2007). However, finding quasar-galaxy pairs at these close separations remained observationally expensive. In previous studies, the absorber host galaxies were generally found at an average galactocentric distance of ∼100 kpc (Kacprzak et al. 2008; Chen et al. 2010; Nielsen et al. 2013; Lundgren et al. 2021). In MusE GAs FLOw and Wind (MEGAFLOW) studies, targeting the CGM at close galactocentric distances (≲100 kpc) around galaxies at intermediate redshifts (z ∼ 0.5 − 1.5), found the signature of biconical outflow and co-rotating gaseous discs, suggesting that the mass accretion rates from the CGM are adequate for sustaining star formation (Schroetter et al. 2019; Zabl et al. 2021; Schroetter et al. 2024).
The fibre-based spectroscopic surveys, using a finite fibre size of radius 1 − 1.5 arcsec, trace a physical area of 5−10 kpc over a redshift window of 0.3 ≤ z ≤ 1.5 around the central quasar. Thus, enable to probe the galaxies at quasar proximity of ≲20 kpc (Noterdaeme et al. 2010; Straka et al. 2015; Joshi et al. 2017; Das et al. 2025). Das et al. (2025, hereinafter Paper II), investigated the galaxies hosting Mg II absorbers over a redshift range of 0.4 ≤ z ≤ 1 by searching strong nebular emission lines (O [II], O [III], Hβ) in background quasar spectra and associated photometric counterparts within 2 arcsec proximity of quasars in the DECaLS imaging survey. It resulted in 216 elusive quasar-galaxy pairs at exclusively low impact parameters of ≲20 kpc, predominantly tracing galaxies with a star formation rate (SFR) of −3.7 ≤ log SFR [M⊙ yr−1] ≤ 2.3 and a stellar mass ranging between 7.9 ≤ log(M★/M⊙)≤11.1. A positive correlation between the absorber strength and SFR and specific SFR supports the wind origin. It is further reinforced by the near-constant absorption intensity at low-impact parameters, which points to the possible contribution of strong outflows and satellite galaxies in the metal enrichment of the galaxy halo (Weng et al. 2024).
In this study, we advance the investigation of Mg II absorber host galaxy from Paper II by leveraging 270 529 Mg II absorbers from the value-added catalogue of the Dark Energy Spectroscopic Instrument (DESI) Data Release-1 (Napolitano et al. 2023) and ≈14 000 square degrees imaging data from the Dark Energy Spectroscopic Instrument (DESI) Legacy Surveys (DECaLS1; Dey et al. 2019). This paper is structured as follows. Section 2 describes our sample selection and analysis. Section 3 examines the absorber galaxy association and the nature of galaxies associated with Mg II absorbers. The conclusions of this study are summarized in Sect. 4. Throughout, we have assumed a flat Universe with H0 = 70 km s−1 Mpc−1, Ωm = 0.3, and ΩΛ = 0.7.
2. Sample and analysis
We used the DESI-DR1 value-added catalogue of Mg II absorbers, comprising 137 328 quasar sightlines, hosting 162 836 absorbers with a redshift of zabs ≤ 1.6, ensuring a coverage of [O II] λλ3727, 3729 nebular emission in DESI spectra. In addition, we augmented the sample with 58 993 Mg II absorbers within 1 ≤ z ≤ 1.5 along 52 369 SDSS quasar sightlines (Zhu & Ménard 2013; Anand et al. 2021), extending our Mg II absorber host galaxy search beyond the redshift window of z ∼ 1 adopted in Paper II. To find the absorber host galaxy, we followed the procedure adopted in Paper II. In brief, firstly we searched the quasar sightlines that have at least one photometric counterpart within 2 arcsec of the quasar in the DECaLS imaging survey2. The DECaLS covers ≈14 000 sq. degrees of sky in the g, r, z optical passbands at a 5σ survey depth of g = 24.0, r = 23.4, and z = 22.5 AB magnitudes (Dey et al. 2019). The sample summary is given in Table 1, including 24 848 and 9193 photometric objects near quasars from DESI and SDSS, respectively.
Summary of the sample of Mg II absorbers.
2.1. Searching nebular emission lines
Next, for the absorber-galaxy association, we searched for the strong nebular emission lines from potential host galaxies. Following Paper II, we searched for the [O II] λλ3727, 3729 nebular emission for each Mg II absorber close to the absorber redshift (zabs) in the quasar continuum-subtracted spectrum. We modelled the emission feature with a Gaussian kernel over the velocity range of ±400 km s−1 around zabs and determined the detection significance based on the signal-to-noise ratio defined in Bolton et al. (2004) as  , where fi is the residual line flux in the ith pixel, σi is the flux error, and ui is a Gaussian kernel, normalized such that ∑iui = 1. The position and line width of the kernel were determined by minimizing the χ2 over the defined velocity window. This resulted in a sample of 556 galaxies with a O [II] emission line detected at a level of > 2.5σ, including 533 galaxies at a level of O [II] > 3σ. Furthermore, we searched Hβ, and [O III] λλ4959, 5007 nebular emissions from the galaxy. We performed a visual search for any bad pixels, continuum, or strong skyline regions. Among 556 O [II] selected galaxies, we found 53 galaxies with additional [O III] λ5007 and Hβ as well as 81 galaxies with only [O III] λ5007 nebular emission, detected at a level of ≥3σ. Furthermore, three additional systems were found based on only [O III] λ5007 and Hβ nebular emission, resulting in a final sample of 559 Mg II galaxies. The sample summary, including the absorber sightlines, proximate galaxies, and emission line-selected galaxies, is given in Table 1.
2.2. Mg II absorber host in DECaLS residual images
To search for galaxies producing strong Mg II absorption, we further explored the residual images provided by DECaLS. For this, we explored DESI residual images with non-zero residual flux at the quasar location with 5 contiguous pixels at a level of ≥3σ. The residual images were obtained using the Tractor algorithm, which models each source, detected in three individual-band image stacks at the 6σ level. In the Tractor, each source was modelled using a small set of parametric light profiles, including a delta function for point sources, a de Vaucouleurs law, an exponential disc, or a composite de Vaucouleurs plus an exponential. Assuming the same model across all the bands, the same light profile (an exponential disc, de Vaucouleurs, or combination) was consistently fitted to all images to determine the best-fit source position, source shape parameters, and photometry (Dey et al. 2019). We note that modelling uncertainties related to source morphology, blending, and saturation may lead to more false positives in residual-based searches. To mitigate this, we firstly searched for the O [II] nebular emission for all Mg II absorbers in our sample (see column 1 Table 1). Since our search relies solely on O [II] emission, we imposed a strict detection criterion of ≥3σ to reduce false positives, which resulted in 900 detections (see also, Joshi et al. 2017). Among them, we found 562 bona fide Mg II absorber host galaxies with O [II] nebular emission and a photometric counterpart in the residual images. Figure 2 shows examples of absorber galaxy candidates identified in DECaLS residual images.
2.3. Modelling the spectral energy distribution
To determine the key physical parameters of a galaxy, such as the SFR and stellar mass, we performed multi-band SED fitting. From the DECaLS photometric catalogue, we included DECaLS optical passband g, r, i, z fluxes, along with the mid-infrared passbands W1 and W2 from unblurred Wide-field Infrared Survey Explorer (unWISE) co-added images reaching up to a 5σ depth of 20.0 and 19.3 AB magnitudes in W1 and W2, respectively (Dey et al. 2019). The mid-infrared unWISE fluxes were obtained with forced photometry whereby each optically detected source was modelled by forcing the location and shape of the model by convolving with the WISE PSF and fitting to the WISE stacked image (see also, Lang et al. 2016). Furthermore, we searched for near-infrared J, H, Ks passband images from the VISTA Surveys3. We found 185 sources in the VHS (at a 5σ depth of J = 21.2, H = 20.6, Ks = 20.0) survey and 100 in the VIKING (at a 5σ depth of J = 22.1) survey. We obtained the near-IR fluxes by simultaneously modelling the quasar and the galaxy at the centroid obtained from DESI images. In the case of non-detection, we estimated the flux upper limits at a level of 4σ. For reasonable SED model parameters, we demanded that the target be detected (at a level of 4σ) in any of the three filters mentioned above, resulting in 465 sources, of which more than ∼75% of the systems have a minimum four-band detection. The galaxy SED were modelled using BAGPIPES4 (Carnall et al. 2018) and the MultiNest sampling algorithm (Feroz et al. 2009). For this, we fixed the galaxy redshift determined based on O [II] nebular emission. Here, we used a simple model considering a delayed star formation history with a wide parameter space for the age, of between 50 Myr to 13.5 Gyr, mass formed (6 ≤ log(M*/M⊙)≤13), and metallicity (0.005 < [Z/H] < 5). We assumed the dust extinction law of Calzetti et al. (1994) with a total extinction of 0 < Av < 4.
3. Results and discussions
In this section, among 559 legitimate Mg II absorber galaxies from the present study, we use 342 galaxies with robust SED-based estimation of stellar mass and SFR to explore the nature of galaxies hosting Mg II absorbers. The examples of Mg II absorber galaxies from our detection set are shown in Fig. 1. To strengthen the statistical analysis, we complement the above sample with 216 galaxies from Paper II with well-constrained SFR and stellar mass parameters. This results in a large dataset of 558 galaxies, providing access to the largely unexplored impact parameter ranges of 4 to 24 kpc over a wide redshift range of 0.3 to 1.6.
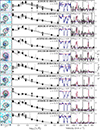 |
Fig. 1. Postage stamps DECaLS colour composite, centred on the quasar. The SDSS fibre, with a radius of 1.5″, is indicated by dashed circles, while the solid circular aperture highlights the MgII host galaxy. The second column exhibits the multi-band SED fit at the absorber redshift. Columns three, four, and five show the detected Mg II absorption, and the [O II] λλ3727, 3729 and [O III] λ5007 nebular emission line from the Mg II absorber host, respectively. |
 |
Fig. 2. Faint Mg II absorber galaxy revealed in the DECaLS residual images. These galaxies remained undetected in DECaLS photometry due to the glare of the bright quasar. Each panel shows the g (blue), r (green), z (red) band colour composite inverted-image centred on the quasar (grey contour), marked as star, and the SDSS fibre of radius 1.5 arcsec (dotted circle). The associated Mg II absorption and [O II] λλ3727, 3729 nebular emission line profiles are shown in the bottom left and right insets, respectively. |
3.1. Detection rate of emission selected Mg II absorber galaxies
Firstly, we estimated the detection rate of Mg II galaxies at close impact parameters of ≲20 kpc. The detection rate is defined as the ratio of the number of absorbers associated with a host galaxy identified based on O [II] detections to the total number of absorbers. The histogram in the top panel of Fig. 3 shows the detection fraction as a function of redshift for our primary sample (hatched), including only galaxies with good SED fit, and a secondary sample (dashed) with O [II]-based selection. For z ≲ 1, the average detection rate for the primary set was found to be 0.45%, which reduces to ≲0.1% at z > 1. This is similar to the detection rate of 0.5% from the SDSS-based selection from Paper II. The detection fraction increases by 22% when we consider the secondary detection set. In the bottom panel of Fig. 3, we show the detection fraction with rest-frame W2796. The detection rate increases from ∼0.01% for W2796 ≲ 1 Å to ∼0.6% for ultra-strong Mg II absorbers with W2796 ≥ 3 Å for the primary set. However, the detection fraction mentioned above represents a lower limit, constrained by the finite fibre size, and limited imaging and spectroscopy sensitivity in identifying faint galaxies. In addition, the W2796 was found to be ≥1 Å for ∼95.9% of detections, which can be understood with the observed anti-correlation between W2796 and the impact parameter (Chen et al. 2010; Nielsen et al. 2013; Huang et al. 2021). This further suggests that the stronger absorbers likely trace the complex gas flows within the halos of galaxies, such as those driven by outflows or associated with accretion processes.
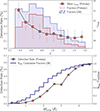 |
Fig. 3. Detection probability of Mg II absorbers. Top: Detection fraction as a function of redshift for primary (hatched), and after incorporating the secondary (dashed) set. The average DECaLS rmag of galaxies per redshift bin is shown as a square, along with the 16th and 84th percentiles. Bottom: Detection rate of Mg II absorber host galaxies with equivalent width (W2796) for primary sample with z < 1.6 (square). The cumulative fraction for all detections, including primary and secondary samples, is given by the right-hand-side ordinates. |
3.2. Physical properties of Mg II absorber host galaxies
Using the largest set of spectroscopically identified Mg II absorber host galaxies at a quasar proximity of ≲24 kpc, we performed multi-band SED modelling to derive the key physical parameters, such as stellar mass and SFR (see Sect. 2.3). We found that the Mg II galaxies, traced by strong nebular emission lines, probe a wide range of stellar mass (7.9 ≤ log(M★/M⊙)≤11.6), with an average ⟨log M★⟩ = 9.9 M⊙. These galaxies form stars with −1.7 ≤ log SFR [M⊙ yr−1] ≤ 2.7, at a median ⟨ log SFR [M⊙ yr−1]⟩ of 0.9. At first, we explored the Mg II absorber galaxies on the star formation main-sequence plane (see Fig. 4). The stellar mass versus star formation distribution shows that the majority of Mg II galaxies are consistent with the main-sequence relation for ⟨z⟩∼0.8 star-forming galaxies. The best fit relation from Popesso et al. (2023) is shown as a solid red curve. A large fraction of galaxies with masses of log(M★/M⊙) > 10.5 are at a higher redshift of z > 0.8, leading to the small deviation from the main-sequence relation. In the top panel of Fig. 4, we compare the SFR, normalized at the respective stellar mass and redshift based on the main-sequence relation. Overall, ∼13.1% of galaxies hosting Mg II absorbers show a starburst nature, with an SFR that is a factor of three to four higher than the one of main-sequence galaxies (Elbaz et al. 2018). For absorption-selected galaxies at the average z ∼ 0.8, the starburst fraction is higher than the 1−3% of the general galaxy population (Arango-Toro et al. 2025). We note that the large fraction of star-forming galaxies in our sample primarily reflects a sample selection bias, as the galaxies were selected based on the presence of strong O [II] nebular emission.
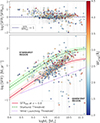 |
Fig. 4. Star formation main-sequence relation for Mg II absorber host galaxies. The symbols are colour-coded with the equivalent width. The shaded and hatched regions indicate the 1σ confidence interval. Additionally, the dotted line represents the SFR threshold for wind launching from Murray et al. (2011). Top: SFR of Mg II galaxies normalized by the main-sequence star-forming galaxy at the respective redshift. |
Assuming that host galaxies do not harbour AGNs and stars as the ionizing source, we derived the O [II]-based SFR from the scaling relation given in Eq. (5) of Zhuang & Ho (2019). The O [II]-based SFRs were found in the range of 0.1 to 14.9 M⊙ yr−1. Furthermore, considering the characteristic luminosity of log(L★ [erg s−1]) = 40.58, for the O [II] luminosity function at an average redshift of ⟨z⟩∼0.8 in our sample, the O [II] nebular line luminosity ranges between 0.3−68.9 L★O [II]. It is worth recalling that the fibre aperture encompasses only a fraction of the total galaxy extent, resulting in the flux losses in the finite fibre size (López & Chen 2012; Joshi et al. 2017). Therefore, the measured O [II] emission line fluxes represent the lower limits. In addition, the derived SFRs are systematically smaller than the SED-based SFRs due to the fact that dust reddening is not taken into account. Henceforth, we used the SED-based SFR to study the characteristics of absorber host galaxies.
In Fig. 5 we explore the dependence of Mg II absorber strength on galaxies’ key physical parameters, such as M★, SFR, specific star formation (sSFR), and SFR surface density (ΣSFR [M⊙ yr−1 kpc−2]). The median W2796 over three equal bins of M★, SFR, sSFR, and ΣSFR are shown as a square. The strength of W2796 is mildly correlated with the stellar mass, with Kendall’s τ correlation coefficient of τk = 0.07 and a null probability of pnull = 0.01. Analysing the average Mg II absorption strength in the halo of ∼0.4 million star-forming galaxies (ELGs), Chen et al. (2025) found that W2796 strongly depends on stellar mass with  over ρ < 100 kpc for galaxies with log(M★/M⊙)≤10 and remains independent for higher-mass galaxies (see also, Dutta et al. 2020). In contrast to the lack of correlation reported in Paper II, the statistically robust sample reveals a weak correlation. It can be partially explained by the higher covering fraction observed in the halos of high-z galaxies (Zahedy et al. 2019; Dutta et al. 2020; Anand et al. 2021) and simulations (Ho et al. 2020; Nelson et al. 2020; Ramesh & Nelson 2024). In addition, the large spread in W2796 suggests that the CGM is not smooth, homogeneous, and isotropic near the disc-halo interface, where strong outflows and gas accretion are evident (Nielsen et al. 2013; Tumlinson et al. 2017; Ponti et al. 2023; Bisht et al. 2025).
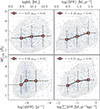 |
Fig. 5. Distribution of Mg II equivalent width with the galaxy stellar mass (top left), SFR (top right), specific SFR (bottom left), and SFR surface density (bottom right). The square symbols represent the median values over three equal bins. The error bar represents the 68th percentile confidence interval. |
In addition, the W2796 is found to be more strongly correlated with the SFR with Kendall’s τ correlation coefficient of τk = 0.19 with a null probability of pnull ≲ 0.01 (see Fig. 5). The increase in the incidence of outflows with SFR suggests that the Mg II absorbers in our sample preferentially originate in galactic outflows (see also, Cicone et al. 2016). To further examine this relationship, we analyse W2796 dependence on the ΣSFR in the bottom right panel of Fig. 5. The average ΣSFR was estimated by normalizing the SED-based SFR with the galaxy area measured from the best-fit ellipse parameters (Dey et al. 2019). The W2796 shows a strong dependence on ΣSFR with Kendall’s τ correlation coefficient of τk = 0.21 and a null probability of pnull ≲ 0.01. The majority 428/558 (76.7%) of galaxies have ΣSFR ≳ 0.05 M⊙ yr−1 kpc−2, sufficient to drive outflows of 104 K gas in galaxy halos out to 50−100 kpc (Murray et al. 2011; Hopkins et al. 2012; Schroetter et al. 2024; Reichardt Chu et al. 2025). The higher SFR of Mg II selected galaxies, along with a strong correlation with key physical parameters, i.e. SFR, ΣSFR, and M★, suggests that Mg II absorbers have a wind origin (see also, Rubin et al. 2018; Bordoloi et al. 2011; Schroetter et al. 2024).
3.3. Redshift evolution of cool gaseous halo
The galaxies evolve significantly in morphology, having more compact and asymmetric profiles, and excess star-formation at high-z, than their low-z counterparts of similar masses (Behroozi et al. 2013). In particular, galaxies at z ∼ 2 are seen actively forming stars and hosting super-galactic winds that are likely effective in replenishing the CGM with metal-enriched gas (Nielsen et al. 2020). Cosmological hydrodynamical simulations show that along with the galaxy, the gaseous halos undergo considerable changes in physical and dynamical states, such as density, temperature, metallicity, velocity, and angular momentum. For instance, high-z gaseous halos have nearly as much cool (T < 105 K) gas as hot (T ≥ 105 K) gas out to R200, while low-z halos have five times more hot gas than cool gas (Huscher et al. 2021).
From an observational perspective, Chen (2012) compared the average equivalent width of H II, C IV, and Mg II absorption profiles from various absorption-line surveys conducted in the vicinities of galaxies over redshifts of z ∼ 0 to 2.2. They observed a good agreement in the spatial extent and mean absorption equivalent width between the CGM at low and high redshifts across the 11 Gyr of galaxy evolution. It primarily reflects a similar kinematics and volume filling factor of gaseous clumps in galactic halos (see also Rudie et al. 2019; Dutta et al. 2020). Using DESI-Y1 data of 2.5 million ELGs and 1.4 million background quasars, Wu et al. (2025) studied the evolution of cool gas, traced by Mg II absorption, in galaxy halos over z = 0.75 to 1.65. Conversely, they found that ELGs at higher redshifts, 1.0 < z < 1.65, harbour systematically higher gas fractions over spatial scales ranging from 20 kpc to 1 Mpc. Interestingly, in a follow-up analysis with the DESI-EDR data, Chen et al. (2025) found no such trend over ≤1 Mpc scales. The excess absorber strength of high-z galaxies in the stacking analysis (Wu et al. 2025) is attributed to high-z galaxies having higher M★ than their low-z counterparts (see also Chen et al. 2025).
In order to discern the evolution of cool gas in halos with redshift at small impact parameters of < 20 kpc, in Fig. 6 we show the W2796 versus galactocentric distances from the galaxy, normalized by the virial radius (ρ/Rvir), for our entire sample, colour-coded with redshift. Further, we estimated the halo mass by converting the stellar mass into the halo mass using the stellar-to-halo mass relation from Girelli et al. (2020). It is apparent that the absorbers at higher redshift show higher W2796 than their low-z counterparts. We subdivided the sample into three redshift intervals of z ≤ 0.5, 0.5 ≤ z ≤ 1.0, and z > 1, consisting of 50, 379, and 129 galaxies, respectively. Despite higher-z absorbers probing larger galactocentric distances, due to a larger projected fibre area, a systematic increase in the average W2796 of 2.1 Å, 2.4 Å, and 2.8 Å (each with mean error of 0.1 Å) is observed with z. Further, we compared the average W2796 as a function of ρ/Rvir over the above three z bins. The absorbers at z > 1 clearly show a higher W2796 (red-circle) compared to absorbers at z ≤ 0.5 (blue square), 0.5 ≤ z ≤ 1.0 (green triangle).
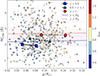 |
Fig. 6. Radial dependence of Mg II absorption strength. Mg II absorber rest-frame equivalent width versus impact parameter normalized by the galaxy’s virial radius (ρ/Rvir). The best fit for high-z (z ∼ 1.1) and low-z (z ∼ 0.5) subsets comprising the top and bottom 30% of the sample is shown as a dashed and solid line, with 1σ uncertainty as a hatched region. The average W2796 for the z ≤ 0.5 (blue square), 0.5 ≤ z ≤ 1.0 (green triangle), and z ≥ 1 (red circle) subsets, for ρ/Rvir bins shows a clear evolution of mean absorption strength. |
Furthermore, we modelled the Mg II absorption strength as a function of ρ by fitting a log-linear model, log W2796 (Å) = α + β × (ρ/Rvir), with a likelihood function given in Eq. (7) of Chen et al. (2010). For this, we generated the high-z and low-z subsets using the top and bottom 30% of the sample, each consisting of 168 absorbers with average z of 0.5 (0.3−0.7), and 1.1 (0.9−1.6), respectively. The best-fit parameter for the high-z and low-z subsets are  ,
,  and
and  ,
,  , respectively. Figure 6 shows the best-fit log-linear model, along with a 1σ uncertainty in the shaded region. The Mg II absorber strength as a function of ρ/Rvir is observed to be near-constant across all redshifts, whereas the enhanced mean absorber strength is evident in high-z halos. It reiterates the higher gas covering fraction and non-homogeneous nature of CGM due to strong outflows and strong accretion events near the disc, which are more prevalent at higher redshift, where galaxies exhibit a higher SFR and sSFR (Tumlinson et al. 2017; Dutta et al. 2020; Ponti et al. 2023; Ramesh & Nelson 2024; Bisht et al. 2025; Das et al. 2025; Joshi et al. 2025).
We note that the high-z and low-z subsets differ in stellar masses. To address the contribution of stellar mass to the observed excess W2796 at high-z halos (Wu et al. 2025; Chen et al. 2025), we constructed two stellar mass matched subsets by selecting the galaxies with log(M★/M⊙) > 9.9, comprising 123 and 67 galaxies in high-z and low-z bins, respectively. A Kolmogorov-Smirnov (KS) test statistic of D = 0.11 at pnull = 0.66 indicates no significant difference in the M★ distribution of the two subsets. The average W2796 for the mass-matched high-z and low-z subsets is 2.9 ± 0.1 Å, and 2.2 ± 0.1 Å, respectively. The KS-test null probability of the sample being drawn from the parent W2796 distribution is rejected with D = 0.37 at pnull = 0.001. This suggests that the stronger absorption observed in the halos of high-z galaxies reflects an evolution of cool CGM gas with redshift, particularly at small impact parameters. Interestingly, the SFR distribution of the above two subsets is found to be different with KS-test statistics with D = 0.48 and pnull < 0.0001. The median SFR of 21.6 M⊙ yr−1 for the high-z subset and 3.7 M⊙ yr−1 for low-z subsets is comparable and a factor of half that of the main-sequence galaxies, respectively, underscoring the role of feedback processes in enriching the CGM.
3.4. Gas-phase metallicity
The local galaxies exhibit a tight correlation, with a scatter of only ∼0.1 dex, of increasing gas-phase metallicity with increasing galaxy stellar mass across several orders of magnitude, suggesting a close link between metal content and galaxy evolution (Tremonti et al. 2004; Finkelstein et al. 2012). The mass-metallicity relation is observed out to z ∼ 4, with a decrease in the overall metallicity of galaxies with increasing redshift (Zahid et al. 2011, 2014). The metal-enriched outflows and gas accretion play a crucial role in shaping the observed fundamental metallicity relation, with massive and highly star-forming galaxies possessing a higher metallicity than their lower-mass and star-formation counterparts (Mannucci et al. 2010; Lequeux et al. 1979; Tremonti et al. 2004). In this section we explore whether the fundamental relation holds for Mg II absorber host galaxies that are selected based on the O [II] nebular emission line.
At first, we explored the redshift evolution of the gas-phase metallicity of absorption-selected galaxies. For this, we restricted our sample to galaxies with z ≤ 0.93, ensuring that the [O III] λλ4959, 5007 emission line falls within the DESI spectral range. To assess the evolution with redshift, we divided the sample into two redshift bins while considering the absorbers from the top and bottom 30% of redshift distributions, with ⟨z⟩ of 0.5 and 0.8, respectively. We generated the spectral stack for equally divided three mass bins for both low-z and high-z subsets, and estimated the [O II] λλ3727, 3729, [O III] λλ4959, 5007, Hβ line fluxes and metallicity-sensitive emission-line ratio R23 (Alloin et al. 1979). The gas-phase oxygen abundance 12 + log(O/H) was derived by employing a non-parametric approach based on Langeroodi & Hjorth (2026), utilizing the genesis-metallicity tool5. It captures the real empirical trend based on a calibration sample of 1510 galaxies at 0 < z < 10 with direct-method metallicity measurements and a kernel density estimate in the 4D space of O2 = [O II] λλ3727, 3729/Hβ; O3 = [O III] λ5007/Hβ; Hβ equivalent width, and gas-phase metallicity. The left panel of Fig. 7 shows the distribution of metallicity as a function of stellar mass. It is evident that, as for the general galaxy population, the metallicity for Mg II absorber host galaxies evolves with stellar mass. We note that at a median absorber redshift of ⟨z⟩∼0.8, the estimated metallicity for the Mg II absorbers shows a small departure from the mass-metallicity relation for the general galaxy population (Huang et al. 2019) that most likely results from the flux loss in the fibre, which only covers a portion of the galaxy. Furthermore, the galaxies at higher redshifts of ⟨z⟩∼0.8 show a lower metallicity (circle) than the lower-redshift ⟨z⟩∼0.5 systems (square). The observed evolution of Mg II absorption strength at small galactocentric distances (see also, Lundgren et al. 2021; Lan 2020; Wu et al. 2025) emphasizes the co-evolution of the CGM and its host galaxy.
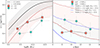 |
Fig. 7. Left: Mass-metallicity relation for Mg II absorber host galaxies considering the top and bottom 30% sample of redshift distribution with ⟨z⟩ of ∼0.5 (square) and ∼0.8 (circle), respectively. The mass metallicity relation, median (solid and dashed curve), and 1σ scatter (hatched region at −45 and 90°), observed for z ∼ 0.1 (Mannucci et al. 2010) and z ∼ 0.95 galaxies (Huang et al. 2019), respectively. Right: Metallicity gradient with galactrocentric distance for the subset of low (square) and high (circle) mass galaxies with ⟨log(M★/M⊙)⟩ of 9.7, and 10.2, respectively. The dashed and solid curves represent the gas-phase metallicity profiles for star-forming galaxies at z ∼ 0 (red curve) and z ∼ 0.8 (blue curve) in IllustrisTNG-50 (Garcia et al. 2023). |
The DESI fibres, centred on the quasars, sample a broad range of impact parameters (i.e. 4−24 kpc). The finite fibre size partially covers the absorber galaxy. In this configuration, for galaxies at larger impact parameters, the fibre primarily probes the galaxy’s halo or the disc–halo interface, whereas for smaller impact parameters it captures the galaxy disc. In Fig. 7 we present the gas-phase metallicity as a function of galactocentric radius for two stellar mass bins, with log(M★/M⊙) ranging from 7.9−9.8 and 9.8−11.1, and corresponding ⟨log(M★/M⊙)⟩ of 9.5 and 10.1, respectively. The higher-mass galaxies exhibit a declining metallicity gradient with increasing radius, while the lower-mass galaxies show an approximately flat metallicity profile. We further compared it with radial gas-phase metallicity profiles for star-forming galaxy population at redshifts of z ∼ 0 and z ∼ 0.8 from the TNG50 (Garcia et al. 2023). It is evident that the galaxies in the TNG50 simulation exhibit a decline in metallicity with increasing radius. In addition, the metallicity estimates for Mg II absorber host galaxies for high-mass bins are consistent with the star-forming galaxy in TNG50. Conversely, no such radial gradient is observed for the low-mass galaxies. Decataldo et al. (2024) analysed the origin of the metal-enriched cold CGM in the smoothed particle hydrodynamics cosmological zoom-in simulation Eris2k. They show that the outflows make a major contribution to the cold CGM gas budget at z < 1, with almost 50% of the hot gas cooling in outflow. The higher gas-phase metallicty in galaxy halos and higher SFRs reaffirms that galaxies exhibiting strong Mg II absorption are typically star-forming systems characterized by ubiquitous outflows.
3.5. Absorber kinematics
The strong Mg II absorbers in low-resolution spectra largely trace the multiple gas cloud clumps (Churchill et al. 2013). To map the underlying motion, we estimated the line-of-sight velocity offset (ΔV) between the systemic galaxy redshift based on O [II] emission and Mg II absorber cloud. Figure 8 shows ΔV versus galaxy halo mass (see Sect. 3.3). The ΔV ranges between −389 to 364 km s−1, with a dispersion of 88 km s−1 and mean velocity difference of −23 km s−1. The escape velocities at an average impact parameter of 10 kpc and 30 kpc with respect to mass are shown as dashed and dash-dotted curves, respectively. It is evident that the majority of the Mg II absorber clouds have velocities lower than the expected projected escape velocities, indicating that they are bound to dark matter potential and are likely recycled back into the galaxy as galactic fountains. Previous studies of gas traced by different ions, such as Mg II, C IV, and O VI, show similar results (Tumlinson et al. 2011; Bordoloi et al. 2014; Anand et al. 2021) and are consistent with high-resolution CGM-ZOOM simulations showing halo gas undergoing multiple phases of recycling through galactic fountains (Suresh et al. 2019).
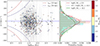 |
Fig. 8. Left: Relative Mg II absorption velocities to the galaxy systematic redshifts as a function of inferred dark matter halo mass; colour-coded with W2796. The line-of-sight projected halo escape velocities at distances 10 and 30 kpc, assuming an NFW profile of dark matter halos, are marked as dashed and dash-dotted curves. Right: Area-normalized histogram of relative velocity of Mg II absorbers in star-forming galaxies for three mass bins of log(M★/M⊙ ≤ 9.5 (hatched at 45°), 9.5 ≤ log(M★/M⊙)≤10.2 (hatched at −45°), and log(M★/M⊙ ≥ 10.2 (filled histogram). The Gaussian profile for the high-mass bin (solid curve) shows a higher velocity dispersion with σ = 97 km s−1 than σ = 73 km s−1, σ = 87 km s−1 for the respective low-mass bins of log(M★/M⊙)≤9.5 (dashed curve), and 9.5 ≤ log(M★/M⊙)≤10.2 (dotted curve). |
Using galaxy-quasar pairs of 211 isolated and 43 non-isolated galaxies at ⟨z⟩∼0.21 and projected distances of ⟨ρ⟩ 86 kpc, Huang et al. (2021) found that the velocity distribution of absorbing gas depends on host galaxy properties. For star-forming galaxies, a 20% excess of velocity dispersion (σ) is observed for high-mass (⟨log(M★/M⊙)⟩ ∼ 10.7) galaxies compared to a low-mass (⟨log(M★/M⊙)⟩ ∼ 9.7) subset with σ ∼ 83 km s−1 and 67 km s−1, respectively. In the right panel of Fig. 8, we show the velocity dispersion for three mass bins of log(M★/M⊙)≤9.5, 9.5 ≤ log(M★/M⊙)≤10.2, log(M★/M⊙) > 10.2, consisting of 97, 296, and 161 galaxies, respectively. For the above three subsets, the mean velocity offset is found to be ΔV ∼ −13, −24, and −28 km s−1. Similarly, the velocity dispersion of Mg II absorbers positively correlates with the increasing stellar mass, with σ = 73, 87, and 97 km s−1, respectively. We further estimated the 68th percentile confidence interval using a bootstrap analysis. The σ of 78 − 107 km s−1 for high-mass bins of log(M★/M⊙) > 10.2 is ∼30% higher than σ = 58 − 82 km s−1 for low-mass bins of log(M★/M⊙) < 9.5, suggesting a positive correlation with the halo mass. A similar dependence is found for average gas kinematics of Mg II absorbing gas around emission line and luminous red galaxies (Lan & Mo 2018). The higher velocity dispersion in massive galaxies can be understood as a result of high star formation activity regulating the strong winds or gas accretion in the massive halos. In addition, gas associated with satellite galaxies, including gas ejected in winds or ram pressure stripping, can exist in halos for an extended period of time, and can also be smoothly accreted by the central galaxy, leading to excess velocity dispersion (Hafen et al. 2019). This scenario is further corroborated by the CGM in TNG50, where ∼40% of the H I absorber fraction with column density log N(H I) [cm−2] > 16 and ΔV of 70−250 km s−1 is associated with the satellites around the central galaxy of M★ < 109 M⊙ (Weng et al. 2024).
4. Conclusion
We investigated the nature of Mg II absorber galaxies over a redshift range of 0.3 ≤ z ≤ 1.6, at largely unexplored galactrocentric distances of ≲20 kpc. The physical properties, including stellar mass, SFR, and ΣSFR for a large set of 342 absorber host galaxies identified in the present study, combined with 216 galaxies from Paper II, compared with the associated absorber properties, led to the following key results:
-
The average detection rate of Mg II absorber hosts based on a strong nebular emission line in the DESI spectroscopic surveys is ∼0.45% below z < 1. It is preferentially higher towards the strong absorbers, with 253/342 (74%) systems having W2796 ≥ 2 Å. The detection rate increases by a factor of 30, from less than 0.02% to 0.6%, for low W2796 (≤0.5 Å) and ultra-strong absorbers. The Mg II absorber galaxies trace a wide range of stellar mass with 7.9 ≤ log(M★/M⊙)≤11.6, and SFRs of −1.7 ≤ logSFR ≤ 2.7. These galaxies follow the star formation main sequence, with 13.1% of systems exhibiting a starburst nature.
-
The W2796 remains near constant as a function of galactrocentric distances, indicating a patchy structure of CGM and high covering fraction of cool gas in galaxy halos extending out to impact parameters of ≲20 kpc. The mean absorber strength rises from 2.1 Å to 2.8 Å for the galaxies at median ⟨z⟩ of ∼0.4 and ∼1.2, suggesting that the cool gas in halos evolves with redshift. Furthermore, a positive correlation between the physical properties of galaxies (M★, SFR, and ΣSFR) and absorption strength (W2796) suggests that the distribution of the metal-enriched cool gas in the CGM significantly depends on the properties of the central galaxy.
-
The gas phase metallicity of absorption-selected galaxies evolves with stellar mass and redshift, following the mass metallicity relation of general galaxies. For the massive galaxies with ⟨log(M★/M⊙)⟩ ∼ 10.1, the gas phase metallicity declines as a function of radius, whereas the low-mass galaxies ⟨log M★⟩∼9.5 show a relatively shallow evolution. This trend is consistent with the TNG50 galaxies at z ∼ 0.8. It suggests that many Mg II absorber galaxies are representative of ordinary star-forming galaxies.
-
We find that the velocity dispersion of the cool gas increases with halo mass. The wide range of line-of-sight velocities (−389 to 364 km s−1) with an average of −23 km s−1 between galaxy and absorbing gas, and dispersion of 88 km s−1, highlights the dynamical behaviour of CGM, largely contributed by the gas accretion and strong winds in massive halos with high star formation activity. These gas clouds are largely bound to the dark matter potential.
In this study, we have investigated the properties of Mg II absorber host galaxies, specifically focusing on systems detected based on strong O [II] nebular emission and DECaLS imaging, tracing the disc-halo interface. However, it is important to note that the current sample, by design, is biased towards galaxies with high O [II] luminosity and does not represent the general galaxy population of Mg II absorbers. The follow-up study of a luminosity-unbiased sample from deep HSC Subaru imaging (see also Joshi et al. 2025) will help to provide an insight into the diversity of mechanisms responsible for the origin of Mg II absorbers. Note that the previous studies on absorber-galaxy association, tracing large-scale environments, show a preference of a significant fraction, ∼70%, of Mg II absorbers to be associated with galaxy groups (Dutta et al. 2020). Furthermore, the cool circumgalactic gas observed in galaxy clusters highlights the role of satellite galaxies or gas stripping from the cluster satellites (Anand et al. 2022; Mishra & Muzahid 2022; Fresco et al. 2024). A follow-up integral-field study of this sample, focusing on the disc–halo interface and large-scale environment, will help to assess the impact of strong winds and group environments on the CGM.
Data availability
The Mg II absorber host galaxy catalogue for 342 primary and 217 secondary detection set is available at the CDS via https://cdsarc.cds.unistra.fr/viz-bin/cat/J/A+A/709/A238
Acknowledgments
LCH was supported by the National Science Foundation of China (12233001) and the China Manned Space Program (CMS-CSST-2025-A09). We acknowledge the contribution of Alex M. Garcia from the Department of Astronomy at the University of Virginia for providing the Illustris TNG50 simulation data on R23 metallicity gradients. Funding for the Sloan Digital Sky Survey IV has been provided by the Alfred P. Sloan Foundation, the U.S. Department of Energy Office of Science, and the Participating Institutions. SDSS-IV acknowledges support and resources from the Center for High Performance Computing at the University of Utah. The SDSS website is www.sdss4.org. SDSS-IV is managed by the Astrophysical Research Consortium for the Participating Institutions of the SDSS Collaboration including the Brazilian Participation Group, the Carnegie Institution for Science, Carnegie Mellon University, Center for Astrophysics | Harvard & Smithsonian, the Chilean Participation Group, the French Participation Group, Instituto de Astrofísica de Canarias, The Johns Hopkins University, Kavli Institute for the Physics and Mathematics of the Universe (IPMU)/University of Tokyo, the Korean Participation Group, Lawrence Berkeley National Laboratory, Leibniz Institut für Astrophysik Potsdam (AIP), Max-Planck-Institut für Astronomie (MPIA Heidelberg), Max-Planck-Institut für Astrophysik (MPA Garching), Max-Planck-Institut für Extraterrestrische Physik (MPE), National Astronomical Observatories of China, New Mexico State University, New York University, University of Notre Dame, Observatário Nacional/MCTI, The Ohio State University, Pennsylvania State University, Shanghai Astronomical Observatory, United Kingdom Participation Group, Universidad Nacional Autónoma de México, University of Arizona, University of Colorado Boulder, University of Oxford, University of Portsmouth, University of Utah, University of Virginia, University of Washington, University of Wisconsin, Vanderbilt University, and Yale University. The DESI Legacy Imaging Surveys consist of three individual and complementary projects: the Dark Energy Camera Legacy Survey (DECaLS), the Beijing-Arizona Sky Survey (BASS), and the Mayall z-band Legacy Survey (MzLS). DECaLS, BASS and MzLS together include data obtained, respectively, at the Blanco telescope, Cerro Tololo Inter-American Observatory, NSF’s NOIRLab; the Bok telescope, Steward Observatory, University of Arizona; and the Mayall telescope, Kitt Peak National Observatory, NOIRLab. NOIRLab is operated by the Association of Universities for Research in Astronomy (AURA) under a cooperative agreement with the National Science Foundation. Pipeline processing and analyses of the data were supported by NOIRLab and the Lawrence Berkeley National Laboratory (LBNL). Legacy Surveys also uses data products from the Near-Earth Object Wide-field Infrared Survey Explorer (NEOWISE), a project of the Jet Propulsion Laboratory/California Institute of Technology, funded by the National Aeronautics and Space Administration. Legacy Surveys was supported by: the Director, Office of Science, Office of High Energy Physics of the U.S. Department of Energy; the National Energy Research Scientific Computing Center, a DOE Office of Science User Facility; the U.S. National Science Foundation, Division of Astronomical Sciences; the National Astronomical Observatories of China, the Chinese Academy of Sciences and the Chinese National Natural Science Foundation. LBNL is managed by the Regents of the University of California under contract to the U.S. Department of Energy. The complete acknowledgments can be found at https://www.legacysurvey.org/acknowledgment/.
References
- Afruni, A., Fraternali, F., & Pezzulli, G. 2021, MNRAS, 501, 5575 [NASA ADS] [Google Scholar]
- Alloin, D., Collin-Souffrin, S., Joly, M., & Vigroux, L. 1979, A&A, 78, 200 [Google Scholar]
- Anand, A., Nelson, D., & Kauffmann, G. 2021, MNRAS, 504, 65 [NASA ADS] [CrossRef] [Google Scholar]
- Anand, A., Kauffmann, G., & Nelson, D. 2022, MNRAS, 513, 3210 [NASA ADS] [CrossRef] [Google Scholar]
- Arango-Toro, R. C., Ilbert, O., Ciesla, L., et al. 2025, A&A, 696, A159 [NASA ADS] [CrossRef] [EDP Sciences] [Google Scholar]
- Bacon, R., Brinchmann, J., Conseil, S., et al. 2023, A&A, 670, A4 [NASA ADS] [CrossRef] [EDP Sciences] [Google Scholar]
- Behroozi, P. S., Wechsler, R. H., & Conroy, C. 2013, ApJ, 770, 57 [NASA ADS] [CrossRef] [Google Scholar]
- Bielby, R., Crighton, N. H. M., Fumagalli, M., et al. 2017, MNRAS, 468, 1373 [CrossRef] [Google Scholar]
- Bisht, M. S., Sharma, P., Dutta, A., & Nath, B. B. 2025, MNRAS, 542, 1573 [Google Scholar]
- Bolton, A. S., Burles, S., Schlegel, D. J., Eisenstein, D. J., & Brinkmann, J. 2004, AJ, 127, 1860 [NASA ADS] [CrossRef] [Google Scholar]
- Bordoloi, R., Lilly, S. J., Knobel, C., et al. 2011, ApJ, 743, 10 [CrossRef] [Google Scholar]
- Bordoloi, R., Tumlinson, J., Werk, J. K., et al. 2014, ApJ, 796, 136 [NASA ADS] [CrossRef] [Google Scholar]
- Bouché, N., Murphy, M. T., Péroux, C., et al. 2007, ApJ, 669, L5 [CrossRef] [Google Scholar]
- Bouché, N., Hohensee, W., Vargas, R., et al. 2012, MNRAS, 426, 801 [CrossRef] [Google Scholar]
- Calzetti, D., Kinney, A. L., & Storchi-Bergmann, T. 1994, ApJ, 429, 582 [Google Scholar]
- Carnall, A. C., McLure, R. J., Dunlop, J. S., & Davé, R. 2018, MNRAS, 480, 4379 [Google Scholar]
- Chen, H.-W. 2012, MNRAS, 427, 1238 [Google Scholar]
- Chen, H.-W., Helsby, J. E., Gauthier, J.-R., et al. 2010, ApJ, 714, 1521 [NASA ADS] [CrossRef] [Google Scholar]
- Chen, Z., Wang, E., Zou, H., et al. 2025, ApJ, 981, 81 [Google Scholar]
- Churchill, C. W., Nielsen, N. M., Kacprzak, G. G., & Trujillo-Gomez, S. 2013, ApJ, 763, L42 [NASA ADS] [CrossRef] [Google Scholar]
- Cicone, C., Maiolino, R., & Marconi, A. 2016, A&A, 588, A41 [NASA ADS] [CrossRef] [EDP Sciences] [Google Scholar]
- Das, S., Joshi, R., Chaudhary, R., et al. 2025, A&A, 695, A207 [NASA ADS] [CrossRef] [EDP Sciences] [Google Scholar]
- Decataldo, D., Shen, S., Mayer, L., Baumschlager, B., & Madau, P. 2024, A&A, 685, A8 [NASA ADS] [CrossRef] [EDP Sciences] [Google Scholar]
- Dey, A., Schlegel, D. J., Lang, D., et al. 2019, AJ, 157, 168 [Google Scholar]
- Dutta, R., Fumagalli, M., Fossati, M., et al. 2020, MNRAS, 499, 5022 [CrossRef] [Google Scholar]
- Elbaz, D., Leiton, R., Nagar, N., et al. 2018, A&A, 616, A110 [NASA ADS] [CrossRef] [EDP Sciences] [Google Scholar]
- Fernández-Figueroa, A., Kacprzak, G. G., Nielsen, N. M., et al. 2024, MNRAS, 531, 3658 [Google Scholar]
- Feroz, F., Hobson, M. P., & Bridges, M. 2009, MNRAS, 398, 1601 [NASA ADS] [CrossRef] [Google Scholar]
- Finkelstein, S. L., Papovich, C., Salmon, B., et al. 2012, ApJ, 756, 164 [NASA ADS] [CrossRef] [Google Scholar]
- Fossati, M., Fumagalli, M., Gavazzi, G., et al. 2019, MNRAS, 484, 2212 [NASA ADS] [CrossRef] [Google Scholar]
- Fresco, A., Péroux, C., Merloni, A., et al. 2024, A&A, 684, A136 [NASA ADS] [CrossRef] [EDP Sciences] [Google Scholar]
- Garcia, A. M., Torrey, P., Hemler, Z. S., et al. 2023, MNRAS, 519, 4716 [Google Scholar]
- Gauthier, J.-R. 2013, MNRAS, 432, 1444 [NASA ADS] [CrossRef] [Google Scholar]
- Girelli, G., Pozzetti, L., Bolzonella, M., et al. 2020, A&A, 634, A135 [NASA ADS] [CrossRef] [EDP Sciences] [Google Scholar]
- Guo, Y., Bacon, R., Bouché, N. F., et al. 2023, Nature, 624, 53 [NASA ADS] [CrossRef] [Google Scholar]
- Hafen, Z., Faucher-Giguère, C.-A., Anglés-Alcázar, D., et al. 2019, MNRAS, 488, 1248 [NASA ADS] [CrossRef] [Google Scholar]
- Ho, S. H., Martin, C. L., Kacprzak, G. G., & Churchill, C. W. 2017, ApJ, 835, 267 [NASA ADS] [CrossRef] [Google Scholar]
- Ho, S. H., Martin, C. L., & Schaye, J. 2020, ApJ, 904, 76 [NASA ADS] [CrossRef] [Google Scholar]
- Ho, S. H., Martin, C. L., & Schaye, J. 2021, ApJ, 923, 137 [NASA ADS] [CrossRef] [Google Scholar]
- Hopkins, P. F., Quataert, E., & Murray, N. 2012, MNRAS, 421, 3522 [Google Scholar]
- Huang, C., Zou, H., Kong, X., et al. 2019, ApJ, 886, 31 [NASA ADS] [CrossRef] [Google Scholar]
- Huang, Y.-H., Chen, H.-W., Shectman, S. A., et al. 2021, MNRAS, 502, 4743 [NASA ADS] [CrossRef] [Google Scholar]
- Huscher, E., Oppenheimer, B. D., Lonardi, A., et al. 2021, MNRAS, 500, 1476 [Google Scholar]
- Joshi, R., Srianand, R., Petitjean, P., & Noterdaeme, P. 2017, MNRAS, 471, 1910 [Google Scholar]
- Joshi, R., Das, S., Fumagalli, M., et al. 2025, A&A, 695, A206 [NASA ADS] [CrossRef] [EDP Sciences] [Google Scholar]
- Kacprzak, G. G., Churchill, C. W., Steidel, C. C., & Murphy, M. T. 2008, AJ, 135, 922 [NASA ADS] [CrossRef] [Google Scholar]
- Kacprzak, G. G., Murphy, M. T., & Churchill, C. W. 2010, MNRAS, 406, 445 [NASA ADS] [CrossRef] [Google Scholar]
- Kacprzak, G. G., Oppenheimer, B., Nielsen, N., et al. 2025, PASA, 42, e128 [Google Scholar]
- Lan, T.-W. 2020, ApJ, 897, 97 [NASA ADS] [CrossRef] [Google Scholar]
- Lan, T.-W., & Mo, H. 2018, ApJ, 866, 36 [NASA ADS] [CrossRef] [Google Scholar]
- Lang, D., Hogg, D. W., & Schlegel, D. J. 2016, AJ, 151, 36 [Google Scholar]
- Langeroodi, D., & Hjorth, J. 2026, ApJ, 997, L30 [Google Scholar]
- Lequeux, J., Peimbert, M., Rayo, J. F., Serrano, A., & Torres-Peimbert, S. 1979, A&A, 80, 155 [Google Scholar]
- López, G., & Chen, H.-W. 2012, MNRAS, 419, 3553 [CrossRef] [Google Scholar]
- Lundgren, B. F., Creech, S., Brammer, G., et al. 2021, ApJ, 913, 50 [NASA ADS] [CrossRef] [Google Scholar]
- Mannucci, F., Cresci, G., Maiolino, R., Marconi, A., & Gnerucci, A. 2010, MNRAS, 408, 2115 [NASA ADS] [CrossRef] [Google Scholar]
- Mishra, S., & Muzahid, S. 2022, ApJ, 933, 229 [NASA ADS] [CrossRef] [Google Scholar]
- Murray, N., Ménard, B., & Thompson, T. A. 2011, ApJ, 735, 66 [NASA ADS] [CrossRef] [Google Scholar]
- Napolitano, L., Pandey, A., Myers, A. D., et al. 2023, AJ, 166, 99 [NASA ADS] [CrossRef] [Google Scholar]
- Nateghi, H., Kacprzak, G. G., Nielsen, N. M., et al. 2024, MNRAS, 534, 930 [NASA ADS] [CrossRef] [Google Scholar]
- Nelson, D., Sharma, P., Pillepich, A., et al. 2020, MNRAS, 498, 2391 [NASA ADS] [CrossRef] [Google Scholar]
- Nestor, D. B., Johnson, B. D., Wild, V., et al. 2011, MNRAS, 412, 1559 [NASA ADS] [CrossRef] [Google Scholar]
- Nielsen, N. M., Churchill, C. W., & Kacprzak, G. G. 2013, ApJ, 776, 115 [NASA ADS] [CrossRef] [Google Scholar]
- Nielsen, N. M., Kacprzak, G. G., Pointon, S. K., Churchill, C. W., & Murphy, M. T. 2018, ApJ, 869, 153 [NASA ADS] [CrossRef] [Google Scholar]
- Nielsen, N. M., Kacprzak, G. G., Pointon, S. K., et al. 2020, ApJ, 904, 164 [NASA ADS] [CrossRef] [Google Scholar]
- Noterdaeme, P., Srianand, R., & Mohan, V. 2010, MNRAS, 403, 906 [NASA ADS] [CrossRef] [Google Scholar]
- Peroux, C., & Nelson, D. 2024, arXiv e-prints [arXiv:2411.07988] [Google Scholar]
- Péroux, C., Rahmani, H., Quiret, S., et al. 2017, MNRAS, 464, 2053 [CrossRef] [Google Scholar]
- Péroux, C., Nelson, D., van de Voort, F., et al. 2020, MNRAS, 499, 2462 [CrossRef] [Google Scholar]
- Ponti, G., Sanders, J. S., Locatelli, N., et al. 2023, A&A, 670, A99 [NASA ADS] [CrossRef] [EDP Sciences] [Google Scholar]
- Popesso, P., Concas, A., Cresci, G., et al. 2023, MNRAS, 519, 1526 [Google Scholar]
- Rahmati, A., Schaye, J., Bower, R. G., et al. 2015, MNRAS, 452, 2034 [CrossRef] [Google Scholar]
- Ramesh, R., & Nelson, D. 2024, MNRAS, 528, 3320 [NASA ADS] [CrossRef] [Google Scholar]
- Reichardt Chu, B., Fisher, D. B., Chisholm, J., et al. 2025, MNRAS, 536, 1799 [Google Scholar]
- Rubin, K. H. R., Diamond-Stanic, A. M., Coil, A. L., Crighton, N. H. M., & Moustakas, J. 2018, ApJ, 853, 95 [NASA ADS] [CrossRef] [Google Scholar]
- Rudie, G. C., Steidel, C. C., Pettini, M., et al. 2019, ApJ, 885, 61 [NASA ADS] [CrossRef] [Google Scholar]
- Schroetter, I., Bouché, N. F., Zabl, J., et al. 2019, MNRAS, 490, 4368 [CrossRef] [Google Scholar]
- Schroetter, I., Bouché, N. F., Zabl, J., et al. 2024, A&A, 687, A39 [NASA ADS] [CrossRef] [EDP Sciences] [Google Scholar]
- Straka, L. A., Noterdaeme, P., Srianand, R., et al. 2015, MNRAS, 447, 3856 [Google Scholar]
- Suresh, J., Nelson, D., Genel, S., Rubin, K. H. R., & Hernquist, L. 2019, MNRAS, 483, 4040 [NASA ADS] [CrossRef] [Google Scholar]
- Tremonti, C. A., Heckman, T. M., Kauffmann, G., et al. 2004, ApJ, 613, 898 [Google Scholar]
- Tumlinson, J., Thom, C., Werk, J. K., et al. 2011, Science, 334, 948 [CrossRef] [Google Scholar]
- Tumlinson, J., Peeples, M. S., & Werk, J. K. 2017, ARA&A, 55, 389 [Google Scholar]
- Weng, S., Péroux, C., Ramesh, R., et al. 2024, MNRAS, 527, 3494 [Google Scholar]
- Wu, X., Cai, Z., Lan, T. W., et al. 2025, ApJ, 983, 186 [Google Scholar]
- Zabl, J., Bouché, N. F., Schroetter, I., et al. 2019, MNRAS, 485, 1961 [NASA ADS] [CrossRef] [Google Scholar]
- Zabl, J., Bouché, N. F., Wisotzki, L., et al. 2021, MNRAS, 507, 4294 [NASA ADS] [CrossRef] [Google Scholar]
- Zahedy, F. S., Chen, H.-W., Johnson, S. D., et al. 2019, MNRAS, 484, 2257 [NASA ADS] [CrossRef] [Google Scholar]
- Zahid, H. J., Kewley, L. J., & Bresolin, F. 2011, ApJ, 730, 137 [NASA ADS] [CrossRef] [Google Scholar]
- Zahid, H. J., Dima, G. I., Kudritzki, R.-P., et al. 2014, ApJ, 791, 130 [NASA ADS] [CrossRef] [Google Scholar]
- Zhu, G., & Ménard, B. 2013, ApJ, 770, 130 [NASA ADS] [CrossRef] [Google Scholar]
- Zhuang, M.-Y., & Ho, L. C. 2019, ApJ, 882, 89 [CrossRef] [Google Scholar]
- Zibetti, S., Ménard, B., Nestor, D. B., et al. 2007, ApJ, 658, 161 [NASA ADS] [CrossRef] [Google Scholar]
All Tables
All Figures
|
Fig. 1. Postage stamps DECaLS colour composite, centred on the quasar. The SDSS fibre, with a radius of 1.5″, is indicated by dashed circles, while the solid circular aperture highlights the MgII host galaxy. The second column exhibits the multi-band SED fit at the absorber redshift. Columns three, four, and five show the detected Mg II absorption, and the [O II] λλ3727, 3729 and [O III] λ5007 nebular emission line from the Mg II absorber host, respectively. |
| In the text | |
|
Fig. 2. Faint Mg II absorber galaxy revealed in the DECaLS residual images. These galaxies remained undetected in DECaLS photometry due to the glare of the bright quasar. Each panel shows the g (blue), r (green), z (red) band colour composite inverted-image centred on the quasar (grey contour), marked as star, and the SDSS fibre of radius 1.5 arcsec (dotted circle). The associated Mg II absorption and [O II] λλ3727, 3729 nebular emission line profiles are shown in the bottom left and right insets, respectively. |
| In the text | |
|
Fig. 3. Detection probability of Mg II absorbers. Top: Detection fraction as a function of redshift for primary (hatched), and after incorporating the secondary (dashed) set. The average DECaLS rmag of galaxies per redshift bin is shown as a square, along with the 16th and 84th percentiles. Bottom: Detection rate of Mg II absorber host galaxies with equivalent width (W2796) for primary sample with z < 1.6 (square). The cumulative fraction for all detections, including primary and secondary samples, is given by the right-hand-side ordinates. |
| In the text | |
|
Fig. 4. Star formation main-sequence relation for Mg II absorber host galaxies. The symbols are colour-coded with the equivalent width. The shaded and hatched regions indicate the 1σ confidence interval. Additionally, the dotted line represents the SFR threshold for wind launching from Murray et al. (2011). Top: SFR of Mg II galaxies normalized by the main-sequence star-forming galaxy at the respective redshift. |
| In the text | |
|
Fig. 5. Distribution of Mg II equivalent width with the galaxy stellar mass (top left), SFR (top right), specific SFR (bottom left), and SFR surface density (bottom right). The square symbols represent the median values over three equal bins. The error bar represents the 68th percentile confidence interval. |
| In the text | |
|
Fig. 6. Radial dependence of Mg II absorption strength. Mg II absorber rest-frame equivalent width versus impact parameter normalized by the galaxy’s virial radius (ρ/Rvir). The best fit for high-z (z ∼ 1.1) and low-z (z ∼ 0.5) subsets comprising the top and bottom 30% of the sample is shown as a dashed and solid line, with 1σ uncertainty as a hatched region. The average W2796 for the z ≤ 0.5 (blue square), 0.5 ≤ z ≤ 1.0 (green triangle), and z ≥ 1 (red circle) subsets, for ρ/Rvir bins shows a clear evolution of mean absorption strength. |
| In the text | |
|
Fig. 7. Left: Mass-metallicity relation for Mg II absorber host galaxies considering the top and bottom 30% sample of redshift distribution with ⟨z⟩ of ∼0.5 (square) and ∼0.8 (circle), respectively. The mass metallicity relation, median (solid and dashed curve), and 1σ scatter (hatched region at −45 and 90°), observed for z ∼ 0.1 (Mannucci et al. 2010) and z ∼ 0.95 galaxies (Huang et al. 2019), respectively. Right: Metallicity gradient with galactrocentric distance for the subset of low (square) and high (circle) mass galaxies with ⟨log(M★/M⊙)⟩ of 9.7, and 10.2, respectively. The dashed and solid curves represent the gas-phase metallicity profiles for star-forming galaxies at z ∼ 0 (red curve) and z ∼ 0.8 (blue curve) in IllustrisTNG-50 (Garcia et al. 2023). |
| In the text | |
|
Fig. 8. Left: Relative Mg II absorption velocities to the galaxy systematic redshifts as a function of inferred dark matter halo mass; colour-coded with W2796. The line-of-sight projected halo escape velocities at distances 10 and 30 kpc, assuming an NFW profile of dark matter halos, are marked as dashed and dash-dotted curves. Right: Area-normalized histogram of relative velocity of Mg II absorbers in star-forming galaxies for three mass bins of log(M★/M⊙ ≤ 9.5 (hatched at 45°), 9.5 ≤ log(M★/M⊙)≤10.2 (hatched at −45°), and log(M★/M⊙ ≥ 10.2 (filled histogram). The Gaussian profile for the high-mass bin (solid curve) shows a higher velocity dispersion with σ = 97 km s−1 than σ = 73 km s−1, σ = 87 km s−1 for the respective low-mass bins of log(M★/M⊙)≤9.5 (dashed curve), and 9.5 ≤ log(M★/M⊙)≤10.2 (dotted curve). |
| In the text | |
Current usage metrics show cumulative count of Article Views (full-text article views including HTML views, PDF and ePub downloads, according to the available data) and Abstracts Views on Vision4Press platform.
Data correspond to usage on the plateform after 2015. The current usage metrics is available 48-96 hours after online publication and is updated daily on week days.
Initial download of the metrics may take a while.