| Issue |
A&A
Volume 709, May 2026
|
|
|---|---|---|
| Article Number | A138 | |
| Number of page(s) | 11 | |
| Section | Extragalactic astronomy | |
| DOI | https://doi.org/10.1051/0004-6361/202555824 | |
| Published online | 19 May 2026 | |
H.E.S.S. observations of composite Seyfert–starburst galaxies
1
University of Southern Denmark, Campusvej 55, DK-5230, Odense M, Denmark
2
Astronomy & Astrophysics Section, School of Cosmic Physics, Dublin Institute for Advanced Studies, DIAS Dunsink Observatory, Dublin, D15 XR2R, Ireland
3
Max-Planck-Institut für Kernphysik, PO Box 103980, D 69029, Heidelberg, Germany
4
Laboratoire Leprince-Ringuet, École Polytechnique, CNRS, Institut Polytechnique de Paris, F-91128, Palaiseau, France
5
University of Namibia, Department of Physics, Private Bag 13301, Windhoek, 10005, Namibia
6
Centre for Space Research, North-West University, Potchefstroom, 2520, South Africa
7
Deutsches Elektronen-Synchrotron DESY, Platanenallee 6, 15738, Zeuthen, Germany
8
Institut für Physik und Astronomie, Universität Potsdam, Karl-Liebknecht-Strasse 24/25, D 14476, Potsdam, Germany
9
Université Paris Cité, CNRS, Astroparticule et Cosmologie, F-75013, Paris, France
10
Department of Physics and Electrical Engineering, Linnaeus University, 351 95, Växjö, Sweden
11
Institut für Physik, Humboldt-Universität zu Berlin, Newtonstr. 15, D 12489, Berlin, Germany
12
LUX, Observatoire de Paris, Université PSL, CNRS, Sorbonne Université, 5 Pl. Jules Janssen, 92190, Meudon, France
13
Sorbonne Université, CNRS/IN2P3, Laboratoire de Physique Nucléaire, et de Hautes Energies, LPNHE, 4 place Jussieu, 75005, Paris, France
14
IRFU, CEA, Université Paris-Saclay, F-91191, Gif-sur-Yvette, France
15
Friedrich-Alexander-Universität Erlangen-Nürnberg, Erlangen Centre for Astroparticle Physics, Nikolaus-Fiebiger-Str. 2, 91058, Erlangen, Germany
16
Instytut Fizyki Jadrowej PAN, ul. Radzikowskiego 152, ul. Radzikowskiego 152, 31-342, Kraków, Poland
17
School of Physics, University of the Witwatersrand, 1 Jan Smuts Avenue, Braamfontein, Johannesburg, 2050, South Africa
18
School of Physical Sciences and Centre for Astrophysics & Relativity, Dublin City University, Glasnevin, D09 W6Y4, Ireland
19
University of Oxford, Department of Physics, Denys Wilkinson Building, Keble Road, Oxford, OX1 3RH, UK, UK
20
Aix Marseille Université, CNRS/IN2P3, CPPM, Marseille, France
21
School of Science, Western Sydney University, Locked Bag 1797, Penrith South DC, NSW, 2751, Australia
22
Landessternwarte, Universität Heidelberg, Königstuhl, D 69117, Heidelberg, Germany
23
Université Bordeaux, CNRS, LP2I Bordeaux, UMR 5797, F-33170, Gradignan, France
24
Institut für Astronomie und Astrophysik, Universität Tübingen, Sand 1, D 72076, Tübingen, Germany
25
Universität Innsbruck, Institut für Astro- und Teilchenphysik, Technikerstraße 25, 6020, Innsbruck, Austria
26
Universität Hamburg, Institut für Experimentalphysik, Luruper Chaussee 149, D 22761, Hamburg, Germany
27
Obserwatorium Astronomiczne, Uniwersytet Jagielloński, ul. Orla 171, 30-244, Kraków, Poland
28
Institute of Astronomy, Faculty of Physics, Astronomy and Informatics, Nicolaus Copernicus University, Grudziadzka 5, 87-100, Torun, Poland
29
Laboratoire Univers et Particules de Montpellier, Université Montpellier, CNRS/IN2P3, CC 72, Place Eugène Bataillon, F-34095, Montpellier Cedex 5, France
30
INAF – Osservatorio Astronomico di Cagliari, Via della Scienza 5, I-09047, Selargius, CA, Italy
31
Nicolaus Copernicus Astronomical Center, Polish Academy of Sciences, ul. Bartycka 18, 00-716, Warsaw, Poland
32
University of Leicester, School of Physics and Astronomy, University Road, Leicester, LE1 7RH, UK
33
Fakultät für Physik und Astronomie, Julius-Maximilians-Universität Würzburg, Emil-Fischer-Str. 31, 97074, Würzburg, Germany
34
Yerevan Physics Institute, 2 Alikhanian Brothers St., 0036, Yerevan, Armenia
35
Department of Physics, Konan University, 8-9-1 Okamoto, Higashinada, Kobe, Hyogo, 658-8501, Japan
36
Kapteyn Astronomical Institute, University of Groningen, Landleven 12, 9747 AD, Groningen, The Netherlands
37
GRAPPA, Anton Pannekoek Institute for Astronomy, University of Amsterdam, Science Park 904, 1098 XH, Amsterdam, The Netherlands
★ Corresponding authors: This email address is being protected from spambots. You need JavaScript enabled to view it.
Received:
5
June
2025
Accepted:
1
February
2026
Abstract
Context. Composite galaxies that contain both Seyfert and starburst components may produce very high-energy (VHE; > 100 GeV) γ-ray emission at a wide range of spatial scales, from a few Schwarzschild radii of a supermassive black hole (SMBH; RS = 10−6 pc for MSMBH = 107 M⊙) to dimensions of kiloparsec-size jet-driven outflows. In addition to supernova remnants, various sources have been suggested to explain data collected on composite galaxies, including multi-messenger neutrino and ultra-high-energy cosmic-ray data.
Aims. The closest composite Seyfert–starburst galaxies (NGC 1068, the Circinus galaxy, and NGC 4945) are observed with the High Energy Stereoscopic System (H.E.S.S.) to provide constraints on cosmic-ray populations in these systems.
Methods. Data obtained in H.E.S.S. observations have been analyzed to search for VHE γ-ray counterparts to the GeV γ-ray signals detected with Fermi-LAT and for potential spectral components in the VHE range.
Results. No significant signals have been found in these H.E.S.S. data. Upper limits on the VHE γ-ray fluxes were applied to constrain theoretical models involving different spectral components.
Key words: relativistic processes / ISM: jets and outflows / galaxies: Seyfert / galaxies: starburst / gamma rays: galaxies
The authors honor the memory of Sergio Colafrancesco, who brought us together in pursuit of this study during his final years.
© The Authors 2026
 Open Access article, published by EDP Sciences, under the terms of the Creative Commons Attribution License (https://creativecommons.org/licenses/by/4.0), which permits unrestricted use, distribution, and reproduction in any medium, provided the original work is properly cited.
This article is published in open access under the Subscribe to Open model. This email address is being protected from spambots. You need JavaScript enabled to view it. to support open access publication.
1. Introduction
Seyfert galaxies are mostly spiral galaxies that host a supermassive black hole (SMBH) powering an active galactic nucleus (AGN; for a review, see Begelman et al. 1984). In contrast, the Milky Way – a spiral galaxy hosting an SMBH (Ghez et al. 2008; Gillessen et al. 2009) – currently does not have an AGN. Large-scale bubbles observed in the radio band in Seyfert galaxies, including the Circinus galaxy (Elmouttie et al. 1998; Ebrahim 2021) and NGC 1068 (Wilson & Ulvestad 1982), bear a strong resemblance to those blown out of the Milky Way. The latter include the Fermi and eROSITA bubbles, which are kiloparsec-scale γ-ray and X-ray emitting lobes (Su et al. 2010; Predehl et al. 2020). They are thought to have been created by a past episode of Seyfert-like activity lasting for 105 − 6 years at the Galactic center (e.g., Guo & Mathews 2012; Zubovas & Nayakshin 2012). In addition, 430-parsec bipolar radio bubbles in the Galactic center revealed by MeerKAT (Heywood et al. 2019) may be a less energetic version of the process that created the Fermi bubbles. Reflection of X-rays from Sgr A* by dense gas in the Galactic center region allows the study of past flaring activity of the SMBH over hundreds to thousands of years (Vainshtein & Syunyaev 1980). Polarized X-ray emission from molecular clouds in the Galactic center implies that 200 years ago, the X-ray luminosity of Sgr A* was briefly comparable to that of a Seyfert galaxy (Marin et al. 2023). Research on Seyfert galaxies may provide insight into the analogy between bubble-like structures in Seyfert galaxies and the Milky Way.
Models of AGN invoke an SMBH to supply the power that efficiently turns into radiation (e.g., Blandford 1976). The classes of AGN are organized according to their radio-loudness. Radio-loud AGN, including blazars and radio galaxies, are well-known sources of very high-energy (VHE; > 100 GeV) γ-ray emission (Punch et al. 1992; Aharonian et al. 2006a, 2009). The emission from blazar jets is greatly enhanced by the effect of Doppler boosting due to their jets oriented close to the line of sight. Seyfert galaxies host radio-quiet AGN, which have much less powerful jets or no jets at all. The dimming in emission from the outflows in Seyfert galaxies (due to an intrinsically low luminosity) and in radio galaxies (due to an orientation at large angles to our line of sight) brings a new perspective on examining otherwise hidden emission components. If pions are created in plasma particle interactions that involve sufficiently energetic hadrons, then neutral pion decays give rise to VHE γ rays, while charged pion decays result in VHE neutrinos. This makes the VHE γ-ray/neutrino relationship a viable way of probing the innermost regions of AGN (e.g., Eichler 1979). VHE γ-ray observations of nearby Seyfert galaxies, such as NGC 1068, provide information necessary for a joint study of the propagation of VHE neutrinos and hadronic γ rays for a black hole surrounded by gas or photons. Models differ in the predictions of the ratio of γ-ray to neutrino fluxes due to the opacity of γ rays and, as a consequence, neutrino emission can be accompanied by a very small γ-ray flux (Berezinskii & Ginzburg 1981). The Seyfert galaxy NGC 1068 is one of a few prominent VHE neutrino source candidates identified by the IceCube collaboration (Aartsen et al. 2020). However, no VHE γ rays were detected from NGC 1068 in H.E.S.S. observations with low exposure (Aharonian et al. 2005, 2008) and in MAGIC observations with deep exposure of 125 hours (Acciari et al. 2019). The model by Kheirandish et al. (2021) suggests that the Circinus galaxy is the next most promising VHE neutrino emitter among Seyfert galaxies.
Starburst galaxies are characterized by higher star formation rates than regular spiral galaxies. The two archetypical starburst galaxies NGC 253 and M82 were discovered to emit VHE γ rays (Acero et al. 2009; VERITAS Collaboration 2009). NGC 1068, the Circinus galaxy, and NGC 4945 are composite Seyfert–starburst galaxies having strong starburst activity in addition to a Seyfert nucleus. Their γ-ray emission, which was detected with Fermi-LAT, may come from galactic disks and/or AGN (Lenain et al. 2010; Hayashida et al. 2013). NGC 4945 is believed to be one of the likely ultra-high-energy cosmic-ray (UHECR) sources along with another starburst galaxy M82 based on the results by the Pierre Auger Observatory (PAO) and the Telescope Array experiment (Aab et al. 2018; Abreu et al. 2022; di Matteo et al. 2023).
This paper presents the results of deep observations of NGC 1068 and observations of the Circinus galaxy and NGC 4945 with H.E.S.S. The paper is organized as follows. The properties of composite galaxies and their potential for detection in VHE γ rays are provided in Sect. 2. The data analysis and results are reported in Sect. 3. The results are compared with predictions in Sect. 4. A summary is presented in Sect. 5.
2. Composite galaxies as potential VHE sources
NGC 253 is a faint VHE source (H.E.S.S. Collaboration 2018b), and its detection with H.E.S.S. at a 5σ level required a very long exposure of 119 hours (Acero et al. 2009). NGC 253, the Circinus galaxy, and NGC 4945, are located at comparable distances. Therefore, in the absence of relatively strong γ-ray emission from AGN outflows in the latter two galaxies, their detection may similarly require very long exposures. The high-energy (HE; from 100 MeV to 100 GeV) γ-ray luminosity of NGC 1068 in the GeV band is an order of magnitude higher than that of the Circinus galaxy and NGC 4945, while its distance is about four times greater. Consequently, detecting VHE γ-ray emission from NGC 1068 may also necessitate deep observations (see Acciari et al. 2019). Notably, models for γ-ray emission from Seyfert galaxies offer significant flexibility, allowing for VHE γ-ray fluxes detectable by H.E.S.S.
2.1. Composite galaxies: NGC 1068, Circinus, and NGC 4945
NGC 1068 is a face-on, early type, barred spiral galaxy located near the celestial equator and is the brightest Seyfert 2 galaxy (de Vaucouleurs 1973). The distance to NGC 1068 remains somewhat uncertain. The literature describes several measurements, including 10.1 ± 1.8 Mpc (Tully et al. 2009), 11.1 ± 0.5 Mpc (Tikhonov & Galazutdinova 2021), 14.0 ± 2.1 Mpc (Anand et al. 2021), and 16.7 ± 3.0 Mpc (Gao & Solomon 2004, 1′ corresponds to 4.9 kpc at this distance). For consistency with Ackermann et al. (2012a) and Wang & Fields (2018), the distance of 16.7 Mpc is adopted in this paper. NGC 1068 exhibits vigorous starburst activity. It hosts a circumnuclear disk about 200 pc in radius, surrounded by a 2 kpc starburst ring connected to the circumnuclear disk by a bar (García-Burillo et al. 2014). It also harbors a bright radio source with a prominent radio jet (Muxlow et al. 1996) and extended radio lobes (Wilson & Ulvestad 1982). The mass of the SMBH in NGC 1068 is uncertain, with estimates ranging from 8 × 10⁶ M⊙ to 1.5 × 10⁷ M⊙ (e.g., Greenhill & Gwinn 1997; Huré 2002; Lodato & Bertin 2003).
The Circinus galaxy, at a distance of only 4.2 ± 0.7 Mpc (Tully et al. 2009, 1′ corresponds to 1.2 kpc at this distance), is a gas-rich spiral galaxy in the southern constellation of Circinus. It is located about 4° below the Galactic plane and was not discovered until 1977 (Freeman et al. 1977). Much of the gas and dust in the disk of the Circinus galaxy is concentrated in two rings, which are 80 and 430 parsec accross, surrounding its center, and hosting an immense starburst region (e.g., Wilson et al. 2000). At the center there is a Seyfert 2 nucleus, the signature of an SMBH that is accreting surrounding gas and dust. The galaxy shows a spectacular, one-sided [O III] ionization cone (Marconi et al. 1994), whose asymmetry is probably due to extinction by the Circinus galaxy disk (an inclination angle of i ≃ 65°). Additionally, it exhibits bipolar radio lobes, each with a size of ∼1.5 kpc, inflated by kiloparsec-scale outflows (Elmouttie et al. 1998; Ebrahim 2021).
NGC 4945, at a distance of only 3.8 ± 0.3 Mpc (Karachentsev et al. 2007, 1′ corresponds to 1.1 kpc at this distance), is a barred spiral galaxy seen almost edge-on (i ≃ 80°) and located in the southern constellation of Centaurus. It is among the closest objects where AGN and starburst activity coexist. Its SMBH mass is around ∼106 M⊙, close to that of our own Galaxy, but accreting at a much higher rate. Similar to the Circinus galaxy, NGC 4945 contains a highly obscured Seyfert 2 nucleus (Iwasawa et al. 1993). Its nucleus is a hard X-ray source variable on timescales of hours (Puccetti et al. 2014) and one of the brightest Seyfert 2 AGN at energies above 20 keV (Itoh et al. 2008). Below 10 keV, its X-ray emission is only visible through reflected emission due to the large column density (log[HN/cm−2] ∼ 24.7) that completely blocks the primary nuclear emission. The nucleus is surrounded by a starburst disk with 200 pc (11″) diameter oriented in the same direction as the galactic disk (Marconi et al. 2000).
2.2. VHE flux expectations based on GeV emission
NGC 1068 and NGC 4945 were identified with Fermi-LAT sources based on 1.6 years of data, while the identification of the Circinus galaxy required 4 years of data (Lenain et al. 2010; Hayashida et al. 2013). Since then, Fermi-LAT has continuously been collecting data and significantly increased the number of γ rays detected from these sources. The flux normalizations and the photon indices for NGC 1068 and NGC 4945 reported by Lenain et al. (2010) are compatible with the values reported in the Fermi-LAT 14-year catalog of γ-ray sources (4FGL-DR41; Abdollahi et al. 2022) within statistical errors. As for the Circinus galaxy, the flux normalization (see Table 1) reported by Guo et al. (2019) and Ebrahim (2021), and listed in the 4FGL-DR4 catalog is lower than that initially reported by Hayashida et al. (2013). This difference in the GeV flux of the Circinus galaxy results in a longer exposure time needed to detect this source with H.E.S.S. The HE γ-ray photon indices of NGC 1068, the Circinus galaxy, and NGC 4945 are 2.31 ± 0.13, 2.20 ± 0.14, and 2.31 ± 0.10 (Lenain et al. 2010; Guo et al. 2019) and systematically harder than that of the Galactic diffuse emission (Ackermann et al. 2012b). Hereafter, this paper adopts the 4FGL-DR4 catalog’s Fermi-LAT results (Abdollahi et al. 2022) as a benchmark for estimating expectations and for reporting in the figures and compares it to published results from other works where appropriate.
Gamma-ray flux from the Circinus galaxy measured with Fermi-LAT.
Exposure times necessary for 5σ detections in the VHE γ-ray band are estimated on the basis of the sensitivity of the H.E.S.S. array observing at a zenith angle of 18° (for NGC 1068 and NGC 4945) or 37° (for the Circinus galaxy). If adopting the best-fit spectral parameters from the 4FGL-DR4 catalog, the corresponding exposure times for NGC 1068, the Circinus galaxy, and NGC 4945 are 342 hrs, 98 hrs, and 64 hrs. The lack of evidence in the 4FGL-DR4 catalog that these HE γ-ray sources are variable makes the extrapolation based on the square-root-of-exposure-time rule valid (for daily variability of NGC 4945, see Sect. 4.1.2). Given that the single broad spectral component commonly softens from the GeV to the VHE band, the extrapolation based on a phenomenological power-law model is optimistic for such a component; even this approach yields long exposure times for potential detections of these three targets.
Extrapolation of the spectrum from GeV to TeV energies leads to an uncertainty in differential TeV flux because of the statistical error on the photon index in the GeV band. The VHE γ-ray excesses predicted for the H.E.S.S. observations take this uncertainty into account and are reported in Sect. 3.2. Moreover, the photon index in the GeV band can differ from that in the VHE band in the presence of two or more spectral components. H.E.S.S. observations reported in Sect. 3 allowed us to assess VHE properties of these three composite galaxies and to search for new spectral components.
3. H.E.S.S. observations and results
This section reports the results obtained from observations of three composite Seyfert/starburst galaxies with H.E.S.S.
3.1. H.E.S.S. experiment and analysis methods
The H.E.S.S. array consists of five imaging atmospheric Cherenkov telescopes (IACTs). It is located in Namibia at 23°16′18″ southern latitude, 16°30′00″ eastern longitude at an altitude of 1800 m above sea level (Aharonian et al. 2006b). Originally consisting of four 12-meter telescopes (CT1-4), the array was expanded in 2012, becoming HESS-II with the addition of a fifth larger 28-meter telescope (CT5). The 12-meter telescopes, arranged in a square with 120-m sides, have been in operation since 2004 (Hinton 2004). H.E.S.S. employs the stereoscopic imaging atmospheric Cherenkov technique (e.g., Daum et al. 1997). The array with the four 12-meter telescopes is sensitive to γ rays above an energy threshold ∼0.1 TeV for observations at zenith, up to energies of tens of TeV. The 28-meter telescope is located at the center of the array and potentially extends the energy range covered by the array down to energies of ∼20 GeV. The H.E.S.S. II experiment is the first hybrid Cherenkov instrument. The observations with H.E.S.S. reported in this paper were performed in so-called wobble mode (Fomin et al. 1994; Berge et al. 2007). In this mode, the source is alternatively offset from the pointing direction in Right Ascension and Declination typically by  . The data were recorded in 28-minute exposures, called observation runs, to minimize systematic changes in instrumental response. To reduce systematic effects arising from imperfect instrument or atmospheric conditions, good-quality runs (Aharonian et al. 2006b) were selected.
The analyses presented in this paper are based on a semi-analytical model of air showers for the event reconstruction and background suppression (de Naurois & Rolland 2009). This model analysis provides an improved angular resolution and a better sensitivity compared with the traditional image-moments-fitting (Hillas parameter-based) analysis. The gain in sensitivity makes the model analysis powerful for studying faint VHE γ-ray sources. The cut configuration requiring a minimum of 60 photoelectrons per image was used. The On-source counts were extracted from the circular region of  radius centered on each of the three galaxies. This radius corresponds to the selection cut for a VHE point-like source. Each of these galaxies is considered as a point-like source for H.E.S.S. The reflected region background method with multiple Off-source regions (Berge et al. 2007) was used to measure the background for γ-ray-like events. The source significance was calculated using Eq. (17) from Li & Ma (1983). Following the method of Rolke et al. (2005), differential flux upper limits (ULs) were derived at the 95% confidence level under the assumption of a power-law spectrum2, dN/dE ∝ E−Γ, with index Γ = 2.4. The results reported in this paper were cross-checked with an independent analysis performed with gammapy (Donath et al. 2023), by applying the high-level analysis pipeline to data that are processed with an independent low-level chain (ImPACT; Parsons & Hinton 2014).
3.2. Observations, data analyses, and results
This section is divided into three parts focusing on NGC 1068, the Circinus galaxy, and NGC 4945. In each subsection, a summary of the performed H.E.S.S. observations is provided, along with their results.
3.2.1. NGC 1068
H.E.S.S. observations of NGC 1068 were performed from 2004 to 2016. A total of 431 good-quality runs were recorded in the wobble mode. Among these, 354 runs were taken with 12-meter telescopes, 23 runs with only the 28-meter telescope, and 54 runs employed 12-meter telescopes and the 28-meter telescope. Given that the MAGIC observations of NGC 1068 started in January 2016, 279 of the 431 runs, that is 65%, were accumulated with H.E.S.S. prior to the start of MAGIC observations. This percentage increases to 75% if only observations conducted with 12-meter telescopes are analyzed. The zenith angle for the observations is in the range from 23° to 38°, and the mean zenith angle is 26°. They were mostly taken with an offset of  from the target direction, that is (RA, Dec) = (40
 670, −0
 013). The total exposure is 168.5 hours corresponding to an exposure of 144.3 hours corrected for the camera acceptance depending on off-optical axis angle.
The analysis of the H.E.S.S. data on NGC 1068 yields a γ-ray excess of 157 counts above the background (Table 2). The excess corresponds to a significance of 2.0σ and hence no significant signal has been found. Since no significant signal was detected, upper limits were derived. The differential flux upper limits at a confidence level of 95% are shown in Fig. 1 for the full H.E.S.S. data set. This figure along with the other figures in this paper also shows the Fermi-LAT bow tie and the Fermi-LAT 0.1–1 TeV spectral point based on 14 years of Fermi-LAT data and taken from the 4FGL-DR4 catalog (Abdollahi et al. 2022). The LAT spectral point taken from 4FGL-DR4 is consistent with that presented by Ajello et al. (2023), but reported at a marginally higher significance level of  vs.
vs.  , where TS is a test statistic (Mattox et al. 1996), and with smaller uncertainties3. In addition, to increase the fraction of data taken prior to the start of MAGIC observations of NGC 1068, an analysis of observations conducted with only the 12-meter telescopes was performed. This results in an excess of 55.8 events corresponding to a significance of 1.8σ. This suggests that NGC 1068 did not experience any strong, temporal VHE flux variability. Overall, the flux upper limits derived from the deep H.E.S.S. observations are as tight as those derived from the deep MAGIC observations.
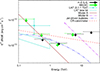 |
Fig. 1. Flux upper limits obtained from H.E.S.S. observations of NGC 1068. This figure also shows MAGIC flux upper limits (Acciari et al. 2019) along with a Fermi-LAT data bow tie and an 0.1-1 TeV data point from the Fermi-LAT catalog (Abdollahi et al. 2022). Models A and B show the absorbed γ-ray flux from the neutrino source (see Sect. 4.2). A model for jet-driven bubbles (Sect. 4.1.1) is provided. The calorimetric bound is also shown. |
H.E.S.S. analysis results.
Based on 4FGL-DR4, the VHE γ-ray excess expected for the H.E.S.S. observations of NGC 1068 is at a statistical significance ranging from 2.1σ to 4.7σ. The non-detection of NGC 1068 with H.E.S.S. is, thus, consistent with the expectation based on the Fermi-LAT flux extrapolation within the framework of a single-power-law model.
3.2.2. Circinus galaxy
H.E.S.S. observations dedicated to the Circinus galaxy were performed from 1st of March 2014 to 5th of May 2014. A total of 26 good-quality runs were recorded in the wobble mode. Among these, 21 runs were taken with at least four telescopes, including 28-meter telescope, and 5 runs with 12-meter telescopes. The zenith angle for the observations in 2014 is in the range from 42 1 to 44
 6. The offset from the target direction, that is (RA, Dec) = (213
 292, −65
 343), for these observations is
  . Alongside the 26 dedicated observation runs on Circinus, an additional 18 runs targeting nearby sources were also included. The latter consist of 12 runs taken in May 2006 in the direction of the pulsar PSR J1357−6429, and 6 runs taken in March 2007 in the direction of the pulsar wind nebula HESS J1356-645. Despite the
  separation between the Circinus galaxy and PSR J1357−6429, some of these observations in wobble mode provide a smaller distance, as close as
  , between the camera center and the Circinus galaxy. The additional runs correspond to H.E.S.S. data collected with 12-meter telescopes. The cumulative exposure resulting from all these observations is about 18.4 hours corresponding to an acceptance-corrected exposure of 13.2 hours.
Among the three Seyfert galaxies discussed here, the Circinus galaxy is the closest to the Galactic plane,  . At this Galactic latitude, the Galactic diffuse γ-ray background is still a subdominant component of the background of γ-ray-like events for H.E.S.S. To prevent background-signal contamination from a known VHE γ-ray source in the field of view, HESS J1356−645, an exclusion region was defined around this source (H.E.S.S. Collaboration 2011). The analysis of the H.E.S.S. data accumulated toward the Circinus galaxy yields a γ-ray excess of 213 γ-ray-like events above the background corresponding to a significance of 2.5σ (Table 2). No significant signal has been found. The differential flux upper limits at a confidence level of 95% are shown in Fig. 2.
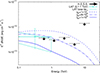 |
Fig. 2. Flux upper limits from H.E.S.S. observations of the Circinus galaxy. This figure also shows a Fermi-LAT data bow tie and an 0.1–1 TeV data point from the Fermi-LAT catalog (Abdollahi et al. 2022). A model involving gamma-ray emitting lobes is shown for different values of a spectral break. |
Based on 4FGL-DR4, the expected VHE γ-ray excess for the H.E.S.S. observations of the Circinus galaxy ranges from 0.8σ to 2.8σ in significance. Therefore, the non-detection of the Circinus galaxy by H.E.S.S. is consistent with the expectation derived from the Fermi-LAT flux extrapolation under the assumption of a single-power-law model.
3.2.3. NGC 4945
H.E.S.S. observations of NGC 4945 were performed between 2012 and 2015. A total of 104 good-quality runs were recorded in the wobble mode. Among these, 44 runs were taken with 12-meter telescopes and 60 runs in 2015 with only the 28-meter telescope. The zenith angle for the observations with 12-meter telescopes is in the range from 26 3 to 33
 4. The offset from the pointing direction, that is (RA, Dec) = (196
 365, −49
 468), for the observations with 12-meter telescopes is
  and the offset for the observations with the 28-meter telescope is
  . The total exposure resulting from all these observations is 42.7 hours corresponding to an acceptance-corrected exposure of 37.2 hours. The acceptance-corrected exposure accumulated with only the 12-meter telescopes is 17.5 hours and that with the 28-meter telescope is 20.7 hours. 92% and 63% of the runs taken with the 12-meter telescopes and with the 28-meter telescope, respectively, were accumulated when the Swift-AT count rate of NGC 4945 in the 15–50 keV range was above 1.71 × 10⁻³ cts cm−2 s−1. This count rate defines a high hard X-ray state (Wojaczyński & Niedźwiecki 2017).
The analysis of the H.E.S.S. data accumulated toward NGC 4945 yields a γ-ray excess of 9.4 γ-ray-like events above the background corresponding to a significance of 0.4σ (Table 2). Given the nearly equal division of the total exposure between observations with the 12-meter telescopes and with the 28-meter telescope, each of these two data subsets was also analyzed separately. The analysis of data from the 12-meter telescopes yields a γ-ray excess of 17.8 events corresponding to a significance of 0.9σ, while the analysis of data from the 28-meter telescope yields no excess. No strong excess is observed in any of these sets of data and flux upper limits were derived at a 95% confidence level. The differential flux upper limits obtained from H.E.S.S. observations of NGC 4945 with the 12-meter telescopes are shown in Fig. 3.
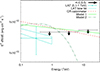 |
Fig. 3. Flux upper limits obtained from H.E.S.S. observations of NGC 4945. The calorimetric bound is from Wang & Fields (2018); Models 1 and 2 are from Wojaczyński & Niedźwiecki (2017) and Xiang et al. (2021), respectively. |
Based on 4FGL-DR4, the VHE γ-ray excess expected for the H.E.S.S. observations of NGC 4945 with 12-meter telescopes is at a significance ranging from 1.9σ to 3.3σ. The non-detection of NGC 4945 with H.E.S.S. is consistent with the expectation based on the Fermi-LAT flux extrapolation using a single-power-law model. Since the obtained significance value (0.9σ) is lower than 3.3σ, it suggests that the photon index is softer than the lower bound of 2.2 of the 68% confidence interval from 4FGL-DR4.
To check whether VHE γ-ray emission is correlated with hard X-ray emission, the analyses of H.E.S.S. data recorded during high and low hard X-ray states were performed separately. None of these analyses reveals a significant excess.
4. Discussion
Over the last decade and a half, γ-ray astronomy has been enriched by observations in the HE γ-ray band with Fermi-LAT and the largest neutrino and UHECR observatories to date, IceCube and PAO, have been operating. Gamma-ray emission from starburst galaxies, composite galaxies, and the Fermi bubbles in the Milky Way was discovered by Fermi-LAT, enhancing our knowledge of galactic emission components. The detection of astrophysical neutrinos made by the IceCube neutrino observatory (IceCube Collaboration 2013) opened a new window to study HE astrophysical sources via the multi-messenger approach. NGC 1068, the blazar TXS 0506+056, and the Milky Way Galactic plane have been shown to be likely VHE neutrino sources (IceCube Collaboration 2018, 2022, 2023). Another multi-messenger channel relevant for these composite galaxies is UHECRs. In contrast to the isotropic model of UHECRs, their origin from starburst galaxies is favored by the PAO data with 4.0σ confidence (Aab et al. 2018). However, other models, including the AGN model of UHECR origin, remain possible.
Together with γ rays, neutrino and UHECR messengers have led to renewed interest in theoretical models describing the observed properties of composite Seyfert/starburst galaxies. Among these properties are the γ-ray flux level, as well as the γ-ray spectral and temporal characteristics. The H.E.S.S. observations of NGC 1068, the Circinus galaxy, and NGC 4945 described in the previous section resulted in flux upper limits on VHE γ-ray emission. To put these upper limits into a larger context, below they are compared with the fluxes obtained with other instruments and with the expectations from theoretical models.
4.1. VHE γ-ray emission due to AGN outflows
Gamma-ray emission produced by AGN outflows can have a spectral shape different from a single power law and/or be variable in time. Models involving AGN have been proposed to describe the measured HE γ-ray fluxes. Such models can produce signals in the TeV γ-ray band of lower or higher luminosity than those expected from a single power-law extrapolation from the GeV γ-ray band to the TeV γ-ray band. On the one hand, in the external inverse Compton (EIC) model (Lenain et al. 2010), VHE γ-ray emission can be within reach of H.E.S.S. only if the maximum energy of electrons is sufficiently high, γmax > 5 × 10⁶. However, given that the characteristic frequency of a soft (external) photon field for NGC 1068 is about 1014 Hz, the electrons that produce VHE emission up-scatter the soft photon targets in the Klein-Nishina regime. Because of the Klein-Nishina suppression of EIC emission at the highest energies, the VHE γ-ray emission predicted by the EIC model remains small. On the other hand, an additional γ-ray component with a hard spectrum, Γ ≃ 2.0, such as that introduced by Lamastra et al. (2016) can account for γ-ray emission due to protons accelerated by AGN-driven shocks. Their AGN outflow model, however, requires acceleration efficiencies for cosmic-ray (CR) protons higher than those commonly assumed in supernova remnant (SNR) shocks. The constraints on parameters of the AGN outflow model derived by Acciari et al. (2019) showed that this model fails to reproduce the broadband γ-ray emission from NGC 1068. Sections 4.1.1 and 4.1.2 describe models of AGN jet activity constrained by H.E.S.S. observations.
4.1.1. Jet-driven bubbles: NGC 1068 and the Circinus galaxy
The Fermi-LAT discovery of the Fermi bubbles (Su et al. 2010) suggests that similar γ-ray-emitting structures can exist in other galaxies. The kiloparsec-scale lobes emitting in the radio band in NGC 1068 (Wilson & Ulvestad 1982) and the Circinus galaxy (Elmouttie et al. 1998; Ebrahim 2021) are candidates. To account for the different astrophysical environments in the Milky Way, NGC 1068, and the Circinus galaxy, the model for the HE γ-ray emission from the Fermi bubbles by Kataoka et al. (2013) requires adjustments. The original model by Kataoka et al. (2013) is a one-zone leptonic model in which the radio emission and the γ-ray emission arise from the same population of relativistic electrons. These emissions occur through the synchrotron process and the inverse-Compton scattering of cosmic-microwave-background photons, respectively. The model assumes that the electron spectrum is a broken power-law function and that the difference between spectral indices above and below the break equals 1. The first adjustment to the original model is that in the more generalized version of the model the interstellar radiation field is considered in addition to the cosmic microwave background field. This difference is significant because the bubbles in NGC 1068 and the Circinus galaxy are located closer to the galactic disks, and the infrared luminosity of NGC 1068 is much stronger than that of the Milky Way. Moreover, on average, photons of the interstellar radiation field are up-scattered by relativistic electrons to higher energies than the cosmic microwave background field. The model of the interstellar radiation field is adopted from the GALPROP code (Porter et al. 2008; Strong et al. 2010) and scaled according to the galactic infrared luminosity. This scaling is supported because the radiation field energy density in starburst galaxies exceeds that of the Milky Way (e.g., Ohm 2016; Yoast-Hull et al. 2016). In our leptonic model, γ-ray emission is luminous at TeV energies but relatively faint in the GeV band, similar to the leptonic models of young shell-type TeV-bright SNRs (e.g., Condon et al. 2017).
The second adjustment to the original model is that CR electrons and magnetic fields are assumed to be in approximate energy equilibrium. Under this assumption, the magnetic field strengths are estimated on the basis of the flux densities measured in the radio band. The magnetic field strength in each of the lobes of the Circinus galaxy is about 3.5 μG, while the magnetic field strengths in the northeast and southwest lobes of NGC 1068 are 87 μG and 44 μG, respectively. For the lobes of the Circinus galaxy and NGC 1068, the total energy required in magnetic fields and relativistic electrons is (2 − 4)×1053 erg, which is a factor of more than 100 smaller than that used by Kataoka et al. (2013) for the Fermi bubbles. Given the typical kinetic power of jets in Seyfert galaxies of 1042 erg/s, such energy can be supplied in an activity episode lasting for ∼104 years. The electron spectra are modeled as a broken power law with a spectral index s = 2.2 below the break energy and s = 3.2 above the energy break. The minimum and maximum Lorentz factors of the electrons are adopted from Kataoka et al. (2013). With these settings, the electron break Lorentz factor is the only free parameter of this model. The dash-double-dotted line in Fig. 1 illustrates the model of VHE emission from the lobes of NGC 1068, which is computed for an electron break Lorentz factor of 3 × 10⁶. Figure 2 shows the model of VHE emission from the lobes of the Circinus galaxy computed for different electron break Lorentz factors and compared to the flux upper limits obtained from the H.E.S.S. observations. In order not to overproduce the derived H.E.S.S. flux upper limits, the electron break Lorentz factor, γbrk, for NGC 1068 and the Circinus galaxy must be lower than 3 × 10⁶ and 4 × 10⁶, respectively. The best-fit value of the energy break obtained by Kataoka et al. (2013) for the Fermi bubbles is γbrk = 106 and below the upper limits on γbrk for NGC 1068 and the Circinus galaxy.
The radiative loss rate is approximately 2.5 times higher in the Circinus lobes, and approximately 50 times higher in the northeastern (NE) lobe and 13 times higher in the southwestern (SW) lobe of NGC 1068 than in the Fermi bubbles for the same electron energy. Consequently, the electron cooling time is shorter by these same factors. The source age for the lobes of both the Circinus galaxy and NGC 1068 is shorter by a factor of 4 for the Circinus lobes, and by factors of 30 for the NE lobe and 18 for the SW lobe of NGC 1068 than that of the Fermi bubbles. This age difference results from their smaller radii – 1 kpc for the Circinus lobes, and 0.13 kpc for the NE lobe and 0.22 kpc for the SW lobe of NGC 1068 – compared to the approximately 4 kpc radius of the Fermi bubbles. Therefore, the energy break in the electron spectrum is expected to be only ∼1.5 times higher for the Circinus lobes and the SW lobe of NGC 1068, but ∼1.5 times lower for the NE lobe of NGC 1068, than in the Fermi bubbles.
4.1.2. Temporal and spectral characteristics of NGC 4945
In contrast to the jet-driven bubble model resulting in steady emission, there are models predicting variable γ-ray emission. The SN rate in starburst galaxies is high and γ-ray emission due to relatively frequent SN explosions can be transient. The HE γ-ray luminosity of the starburst galaxy NGC 2403 above the calorimetric bound was proposed to be caused by an additional component from SN 2004dj (Xi et al. 2020), which is one of the nearest and brightest SNe. The search for VHE γ-ray emission from ten core-collapse SNe observed with H.E.S.S. did not reveal significant emission (H.E.S.S. Collaboration 2019). One of these SNe, SN 2011ja, occurred in NGC 4945. However, the H.E.S.S. data set corresponding to the time interval within one year of SN 2011ja has a short exposure time of 3.4 hours. Another recent event, SN 2018ivc, occurred in NGC 1068 (Bostroem et al. 2020). Given the distance to NGC 1068, the γ-ray flux from this SN is likely to be significantly smaller.
Apart from SNe, AGN in Seyfert galaxies can also produce variable γ-ray emission. For example, variable γ-ray emission from the starburst galaxy NGC 3424 was attributed to an AGN (Peng et al. 2019). For NGC 4945, the models have considered either the temporal or spectral characteristics. These models are discussed in the following.
1. Temporal characteristics: Wojaczyński & Niedźwiecki (2017) reported a hint of an anti-correlation between the daily hard X-ray and HE γ-ray fluxes from NGC 4945, suggesting a significant contribution from the AGN to the HE γ-ray emission. They found that the lower the hard X-ray flux, the higher the HE γ-ray flux. This behavior is reminiscent of the anti-correlation between hard X-ray and HE γ-ray fluxes in the X-ray binary Cygnus X-3 (see, e.g., Piano et al. 2012; Prokhorov & Moraghan 2023). Additionally, they noted that the γ-ray spectrum hardens when the hard X-ray flux increases. The difference between the photon indices in the two states is ΔΓ = 0.36 ± 0.11. Thus, when extrapolated from GeV to TeV energies, the γ-ray contribution from the subdominant component at 100 MeV becomes substantial at TeV energies. Most of the H.E.S.S. observations of NGC 4945, corresponding to 80% of the total exposure time, were performed when the source was in the high hard X-ray flux state. For this state, the flux extrapolated to VHE energies on the basis of the spectral parameters taken from Wojaczyński & Niedźwiecki (2017) is F(> 1 TeV) = (4.3±0.8) × 10−13 cm−2 s−1. This extrapolated flux exceeds the flux upper limit, F(> 1 TeV) < 3.1 × 10⁻¹³ cm−2 s−1, derived from the performed H.E.S.S. observations of the source in the high hard X-ray flux state (see Fig. 3). Model 1 shown in Fig. 3 corresponds to the spectral parameters for the high hard X-ray flux state proposed by Wojaczyński & Niedźwiecki (2017). This constraint suggests the presence of a cut-off in the γ-ray spectrum in the high hard X-ray state. Verification of the two-state behavior using Fermi-LAT and Swift-BAT data, in addition to those already used by Wojaczyński & Niedźwiecki (2017), is warranted.
2. Spectral characteristics: The two-state behavior can lead to a spectral hardening of the HE γ-ray spectrum when analyzing the whole data set under the assumption of a broken power-law spectrum. In this case, the lower-energy part is dominated by a soft γ-ray component produced during the weak hard X-ray state, while the higher-energy part is dominated by a hard γ-ray component produced during the high hard X-ray state. The broken power-law γ-ray spectrum can also result from the presence of two different spectral components, as observed in the spectrum of another nearby galaxy, Centaurus A (Sahakyan et al. 2013; H.E.S.S. Collaboration 2018a). In this light, the recent claim of a spectral hardening in NGC 4945 (Xiang et al. 2021), based on an analysis of 11 years of the Fermi-LAT data, is worth noting. Using a model with two hadronic components, those authors performed a fit to the data and found that the higher-energy component has a very hard proton power-law spectral index of  . This proton spectral index is much harder than the proton spectral index in the nonlinear diffusive shock acceleration scenario, which is softer than 1.5 (for a review, see Malkov & Drury 2001). The differential flux upper limit at 0.84 TeV obtained from the H.E.S.S. observations of NGC 4945 is E2dN/dE < 4.7 × 10⁻¹³ erg cm−2 s−1. Meanwhile, the flux value at this energy in the model with two hadronic components from Xiang et al. (2021) is
  erg cm−2 s−1. Thus, the two-component model overpredicts the VHE γ-ray flux measured with H.E.S.S. (see, Model 2 in Fig. 3). This implies that the values of the spectral parameters for the higher-energy component may differ from those derived by Xiang et al. (2021).
4.2. VHE neutrinos from the surroundings of a SMBH
Given that VHE neutrinos and accompanying γ rays are the decay products of pions created in the pp or pγ interactions, the neutrino channel is used to place constraints on the VHE γ-ray production and absorption. Kinematics of charged and neutral pion decays establish the relation between the fluxes of neutrinos at energy Eν and γ rays at energy Eγ, which is written as
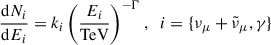
where 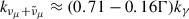 for proton–proton (pp) interactions and
  for proton–photon (pγ) interactions (see Gaisser et al. 1995; Kappes et al. 2007; Ahlers & Murase 2014). Neutrinos are known to interact extremely weakly with matter and can leave their production sites with essentially no attenuation. On the other hand, accompanying γ rays can be heavily absorbed within the source (Jelley 1966; Berezinskii & Ginzburg 1981).
The search for point-like neutrino sources using ten years of IceCube data resulted in an excess of 79 neutrinos associated with NGC 1068 at a significance of 4.2σ (IceCube Collaboration 2022). The reported best-fit flux averaged over the data-taking period at a neutrino energy of 1 TeV is
  cm−2 s−1 TeV−1 and the power-law index is
  . The neutrino flux from this source cannot be explained by the starburst scenarios (see Eichmann & Becker Tjus 2016). In the absence of γ-ray absorption, the expected γ-ray flux equivalent to the detected muon-neutrino flux would be
 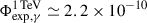 cm−2 s−1 TeV−1 and 4.4 × 10⁻¹⁰ cm−2 s−1 TeV−1 for pp and pγ interactions, respectively. The flux upper limit set by the reported H.E.S.S. observations is significantly smaller. Below, Model A considers the entire energy range, but Model B restricts the energy range from 3 TeV to 30 TeV. The latter energy range corresponds to that for IceCube observations scaled up by a factor of 2 (the average energy of γ rays produced in pp or pγ interactions is twice larger than that of neutrinos). For Model A, the H.E.S.S. upper limit translates to VHE γ-ray flux suppression factors of ≳3750 for pp neutrino sources and ≳7500 for pγ neutrino sources. For the alternative model (Model B), the corresponding VHE γ-ray flux suppression factors are ≳150 and ≳300, respectively. Figure 1 shows the γ-ray fluxes corresponding to the IceCube neutrino flux from a pp (pγ) neutrino source, reduced by a factor of 3750 (7500) for Model A and 150 (300) for Model B due to absorption. Due to the broader energy range, Model A is more constrained by the H.E.S.S. observations than Model B. For guidance purposes, the γ-ray spectra for the models A and B are shown in Fig. 1 as power laws corresponding to constant optical depths.
Additionally, the fact that the neutrino energy flux exceeds the HE γ-ray energy flux may require a significant attenuation of HE γ-rays from the neutrino production site. This implies the presence of a dense X-ray target photon field, which can exist only in the vicinity of SMBHs. Due to the intense X-ray photon field, AGN coronae are one of the most plausible sites for neutrino production (Inoue et al. 2020; Murase et al. 2020; Kheirandish et al. 2021; Eichmann et al. 2022; Mbarek et al. 2024; Neronov et al. 2024; Blanco et al. 2025; Inoue et al. 2024). In the corona model, TeV γ rays are cascaded down to sub-GeV energies (e.g., Murase et al. 2024). VHE neutrino production by protons accelerated in the inner regions of AGN-driven winds near the SMBH is possible for NGC 1068 (Inoue et al. 2022); see also Peretti et al. (2023).
By considering the connection between IceCube neutrinos and HE γ rays in NGC 1068, Murase (2022) computed cascaded γ-ray spectra and showed that the neutrino production region likely lies at R ≲ 100 RS. This is particularly the case in pγ scenarios due to the Bethe-Heitler pair production process, where Murase (2022) obtained R ≲ 30 RS, a scale which also corresponds to the estimated corona size in NGC 1068.
NGC 1068, along with TXS 0506+056, is visible near the horizon from the South Pole and IceCube has a good sensitivity for detection of muon neutrinos from this direction (Aartsen et al. 2020). If detected in neutrinos (e.g., Kheirandish et al. 2021), the Circinus galaxy will provide further insights into extreme astrophysical environments through comparing VHE neutrino and γ-ray fluxes. The progress in enhancing IceCube’s sensitivity for sources in the southern sky can expand searches for neutrino emission to the Circinus galaxy (Mancina & Silva 2021; Yu et al. 2023). The recently reported excess of neutrinos from the Circinus galaxy in the IceCube data highlights this progress (IceCube Collaboration 2026). KM3NeT will reach higher sensitivity to muon-neutrino fluxes from the southern sky and better angular resolution (e.g., Aiello et al. 2024).
4.3. Application to CR energy losses and propagation
The calorimeter model requires that a substantial part of the energy injected in CR protons by SNe be lost to inelastic hadronic collisions before CR escape from starburst galaxies (Thompson et al. 2007). Consequently, the star formation rate determines the CR yield and neutral pion decay dominates γ-ray production. This model well describes γ-ray emission observed from NGC 253 and M 82 (e.g., Lacki et al. 2011; Abramowski et al. 2012).
4.3.1. Calorimetric efficiency
It is important to clarify whether the calorimetric model can describe the γ-ray production in NGC 1068, the Circinus galaxy, and NGC 4945. The γ-ray luminosities of two of these three galaxies, namely NGC 1068 and the Circinus galaxy, in the GeV band were initially found to be significantly higher than those expected from the calorimeter model (Lenain et al. 2010; Hayashida et al. 2013). These high γ-ray luminosities were also treated as evidence that the observed HE γ-ray emission from these two sources is dominated by the central AGN activity. For NGC 1068, Lenain et al. (2010) used the SN rate comparable to those of NGC 253 and M 82 (that is ≃20 ± 10 per century), but the γ-ray luminosity of NGC 1068 is higher by a factor of ∼10. Yoast-Hull et al. (2014) adopted similar SN rates in NGC 1068 and NGC 253 of 10 per century and 7 per century, respectively, and also encountered difficulties in modeling the γ-ray flux of NGC 1068. These difficulties were resolved when the different SN rates in NGC 1068 and NGC 253 of 35 ± 9 per century and 2.6 ± 0.4 per century, respectively, were applied by Wang & Fields (2018). They found that the models both for NGC 1068 and NGC 4945 are consistent with calorimetry, but they noted that the calorimetry relation fails for the Circinus galaxy. In view of the γ-ray flux from the Circinus galaxy measured with Fermi-LAT, as reported by Guo et al. (2019), Ebrahim (2021), we re-examined the constraints set by Wang & Fields (2018). The re-examination shows that the calorimetric efficiency, which is a measure of the ratio of the γ-ray energy output to the SN energy injected in CR protons4 is within the interval of 41%–70% at the 70% confidence level. These values are similar to those obtained for NGC 1068 and NGC 4945. The measured infrared luminosity of NGC 1068 implies its γ-ray luminosity – via the LIR–Lγ correlation for star-forming galaxies (Ajello et al. 2020) – that is significantly higher than those of NGC 253 and M82, consistent with the result from Wang & Fields (2018).
The flux upper limits derived from the H.E.S.S. observations for a proton spectral index of 2.2 set upper limits on the calorimetric efficiencies at 58% and 70% for NGC 1068 and NGC 4945, respectively. To set these limits the predictions from the model by Wang & Fields (2018) were used. These constraints are comparable to the confidence intervals for calorimetric efficiencies of 41%–88% for NGC 1068 and 40%–73% for NGC 4945, as derived by Wang & Fields (2018, see their Fig. 6) from the γ-ray fluxes in the GeV band. These calorimetric efficiencies are higher than those obtained for M82 (35%) and NGC 253 (39%). This shows that the calorimeter model remains a viable explanation of γ-ray emission from NGC 1068 and NGC 4945, considering the H.E.S.S. flux upper limits. The calorimetric bounds (100% efficiency) for NGC 1068 and NGC 4945 taken from Wang & Fields (2018) are compared to the H.E.S.S. flux upper limit in Figs. 1 and 3.
For Circinus, even with 100% efficiency, the predicted fluxes are below the H.E.S.S. limits. This is because both the infrared luminosity and the predicted VHE γ-ray flux for this galaxy are about half that of NGC 4945.
4.3.2. Connection to UHECRs
Although the UHECR sources have not yet been firmly identified, if the CR production rate in UHECR sources extends as a power law down to energies of 1 TeV, then it can lead to VHE γ-ray emission via neutral pion decay.
Atomic nuclei make up ∼99% of the CRs that are detected on Earth. The CR spectrum extends over a vast range of energies from 109 eV to 1021 eV. The initial idea that Galactic CRs originate from SNRs was based on energy budget considerations (Ginzburg & Syrovatskii 1964). Proton acceleration to an energy above 1015 eV pushes shock acceleration theory to its limits when applied to SNRs (Bell 2013). The Larmor radius of a proton with an energy of 1018 eV gyrating in a μG magnetic field is about 1 kpc, so UHECRs are extragalactic in origin since their Larmor radius is larger than the size of the Galaxy.
The correlation between starburst galaxies and UHECR arrival directions (4.2σ) may suggest the existence of sources accelerating CRs above 3.9 × 10¹⁹ eV in these galaxies (see, e.g., Aab et al. 2018; Abreu et al. 2022). A model with 9.7% of the UHECR flux above 3.9 × 10¹⁹ eV from nearby starburst galaxies (the remaining 90.3% are isotropic) was found to be favored (Aab et al. 2018). The starburst model can explain an UHECR hotspot in the direction of the Centaurus A/M83 group owing to the fact that NGC 4945 is a member of the Centaurus A subgroup. The potential CR-UHECR sources include starburst superwinds (Anchordoqui 2018), hypernova remnants (Liu et al. 2014), low-luminosity gamma-ray bursts (Zhang et al. 2018), and kiloparsec-scale jets (Michiyama et al. 2022).
In the galaxy NGC 4945, CR protons with energies from tens of GeV to multi-TeV are trapped by inelastic hadronic collisions and cannot escape. These CRs are scattered by small-scale magnetic irregularities and travel on a long, random-walk path through the dense galactic medium. Consequently, the combination of dense gas and slow CR diffusion is the primary factor trapping these lower-energy CRs. In contrast, UHECRs have larger gyroradii, making them less effectively scattered by magnetic turbulence. They can navigate through the galaxy more directly (in a quasi-ballistic rather than diffusive regime) and escape (e.g., Condorelli et al. 2023). NGC 4945 acts as a CR calorimeter for the former, while it cannot confine the latter; this difference, therefore, establishes the relationship between the hadronic HE-VHE γ-ray emission and the UHECR flux from this galaxy.
The proton luminosity of hypothetical CR-UHECR sources above 10 GeV is estimated here for NGC 4945. The CR spectral production rate in this source is assumed to follow a power-law energy distribution with a spectral index s harder than 2.7 below 3.9 × 10¹⁹ eV. The contribution from this galaxy to the total UHECR flux from starburst galaxies is adopted from Aab et al. (2018). This luminosity is then compared with that provided from SNRs (for SN rates, see Sect. 4.3.1). Since the extrapolated spectrum spans 10 decades of energy, the CR luminosity of hypothetical CR-UHECR sources strongly depends on the spectral index. The CR power produced by hypothetical CR-UHECR sources is comparable with the CR power produced by SNRs if the spectral index is 2.15 and more than 10 times the CR power produced by SNRs if the spectral index is 2.3 or softer. Thus, the calorimetry limit from the H.E.S.S. observations of NGC 4945 (Sect. 3) is violated if CR-UHECR sources have soft spectra, s > 2.15. CR-UHECR sources with softer spectra would be too bright in the VHE γ-ray band, exceeding the H.E.S.S. constraints.
If UHECRs mostly consist of carbon, then the γ-ray fluxes induced by CR-UHECR sources may remain below the upper limits from H.E.S.S. observations when s ≃ 2.2.
5. Summary
This paper describes VHE observations of the nearby composite Seyfert/starburst galaxies NGC 1068, the Circinus galaxy, and NGC 4945 with H.E.S.S. These galaxies have both an AGN and a starburst core. Spiral galaxies hosting an AGN are potentially detectable γ-ray sources due to an SMBH supplying the power that efficiently turns into radiation. Bursts of intense star formation in these three galaxies may result in VHE γ-ray emission produced through the collisions of CR protons accelerated in core-collapse SNRs with interstellar gas. Flux upper limits are obtained here from 168.5 hours, 18.4 hours, and 42.7 hours of H.E.S.S. observations toward NGC 1068, the Circinus galaxy, and NGC 4945, respectively. These upper limits are among the most stringent constraints for these galaxies to date. The non-detection in VHE γ rays has implications for the particle populations and physical conditions in these systems. These upper limits constrain (i) the number of energetic electrons inside the kiloparsec-scale bubbles in NGC 1068 and the Circinus galaxy, (ii) the two-state behavior of NGC 4945, as previously suggested by Fermi-LAT γ-ray observations, (iii) the absorption of VHE γ-rays on soft photons in NGC 1068, in the context of neutrino detection, (iv) the fraction of the SN explosion kinetic energy converted into the energy of CRs in NGC 1068 and NGC 4945, and (v) the spectral hardness of hypothetical CR-UHECR sources in NGC 4945, which produce both CRs interacting with gas and UHECRs observed at Earth. In conclusion, VHE γ-ray observations of composite Seyfert/starburst galaxies probe a broad range of energetic astrophysical phenomena, but higher sensitivity is required for detections.
Acknowledgments
The support of the Namibian authorities and of the University of Namibia in facilitating the construction and operation of H.E.S.S. is gratefully acknowledged, as is the support by the German Ministry for Education and Research (BMBF), the Max Planck Society, the German Research Foundation (DFG), the Helmholtz Association, the Alexander von Humboldt Foundation, the French Ministry of Higher Education, Research and Innovation, the Centre National de la Recherche Scientifique (CNRS/IN2P3 and CNRS/INSU), the Commissariat à l’énergie atomique et aux énergies alternatives (CEA), the U.K. Science and Technology Facilities Council (STFC), the Irish Research Council (IRC) and the Science Foundation Ireland (SFI), the Knut and Alice Wallenberg Foundation, the Polish Ministry of Education and Science, agreement no. 2021/WK/06, the South African Department of Science and Technology and National Research Foundation, the University of Namibia, the National Commission on Research, Science & Technology of Namibia (NCRST), the Austrian Federal Ministry of Education, Science and Research and the Austrian Science Fund (FWF), the Australian Research Council (ARC), the Japan Society for the Promotion of Science, the University of Amsterdam and the Science Committee of Armenia grant 21AG-1C085. We appreciate the excellent work of the technical support staff in Berlin, Zeuthen, Heidelberg, Palaiseau, Paris, Saclay, Tübingen and in Namibia in the construction and operation of the equipment. This work benefited from services provided by the H.E.S.S. Virtual Organisation, supported by the national resource providers of the EGI Federation.
References
- Aab, A., Abreu, P., Aglietta, M., et al. 2018, ApJ, 853, L29 [NASA ADS] [CrossRef] [Google Scholar]
- Aartsen, M. G., Ackermann, M., Adams, J., et al. 2020, Phys. Rev. Lett., 124, 051103 [Google Scholar]
- Abdollahi, S., Acero, F., Baldini, L., et al. 2022, ApJS, 260, 53 [NASA ADS] [CrossRef] [Google Scholar]
- Abramowski, A., Acero, F., Aharonian, F., et al. 2012, ApJ, 757, 158 [NASA ADS] [CrossRef] [Google Scholar]
- Abreu, P., Aglietta, M., Albury, J. M., et al. 2022, ApJ, 935, 170 [CrossRef] [Google Scholar]
- Acciari, V. A., Ansoldi, S., Antonelli, L. A., et al. 2019, ApJ, 883, 135 [NASA ADS] [CrossRef] [Google Scholar]
- Acero, F., Aharonian, F., Akhperjanian, A. G., et al. 2009, Science, 326, 1080 [NASA ADS] [CrossRef] [Google Scholar]
- Ackermann, M., Ajello, M., Allafort, A., et al. 2012a, ApJ, 755, 164 [NASA ADS] [CrossRef] [Google Scholar]
- Ackermann, M., Ajello, M., Atwood, W. B., et al. 2012b, ApJ, 750, 3 [NASA ADS] [CrossRef] [Google Scholar]
- Aharonian, F., Akhperjanian, A. G., Bazer-Bachi, A. R., et al. 2005, A&A, 441, 465 [NASA ADS] [CrossRef] [EDP Sciences] [Google Scholar]
- Aharonian, F., Akhperjanian, A. G., Bazer-Bachi, A. R., et al. 2006a, Science, 314, 1424 [Google Scholar]
- Aharonian, F., Akhperjanian, A. G., Bazer-Bachi, A. R., et al. 2006b, A&A, 457, 899 [NASA ADS] [CrossRef] [EDP Sciences] [Google Scholar]
- Aharonian, F., Akhperjanian, A. G., Barres de Almeida, U., et al. 2008, A&A, 478, 387 [NASA ADS] [CrossRef] [EDP Sciences] [Google Scholar]
- Aharonian, F., Akhperjanian, A. G., Anton, G., et al. 2009, ApJ, 695, L40 [Google Scholar]
- Ahlers, M., & Murase, K. 2014, Phys. Rev. D, 90, 023010 [Google Scholar]
- Ajello, M., Di Mauro, M., Paliya, V. S., & Garrappa, S. 2020, ApJ, 894, 88 [NASA ADS] [CrossRef] [Google Scholar]
- Ajello, M., Murase, K., & McDaniel, A. 2023, ApJ, 954, L49 [NASA ADS] [CrossRef] [Google Scholar]
- Aiello, S., Albert, A., Alshamsi, M., et al. 2024, Astropart. Phys., 162, 102990 [Google Scholar]
- Anand, G. S., Rizzi, L., Tully, R. B., et al. 2021, AJ, 162, 80 [CrossRef] [Google Scholar]
- Anchordoqui, L. A. 2018, Phys. Rev. D, 97, 063010 [CrossRef] [Google Scholar]
- Begelman, M. C., Blandford, R. D., & Rees, M. J. 1984, Rev. Mod. Phys., 56, 255 [Google Scholar]
- Bell, A. R. 2013, Astropart. Phys., 43, 56 [NASA ADS] [CrossRef] [Google Scholar]
- Berezinskii, V. S., & Ginzburg, V. L. 1981, MNRAS, 194, 3 [Google Scholar]
- Berge, D., Funk, S., & Hinton, J. 2007, A&A, 466, 1219 [CrossRef] [EDP Sciences] [Google Scholar]
- Blanco, C., Hooper, D., Linden, T., & Pinetti, E. 2025, Phys. Rev. D, 112, 123016 [Google Scholar]
- Blandford, R. D. 1976, MNRAS, 176, 465 [NASA ADS] [Google Scholar]
- Bostroem, K. A., Valenti, S., Sand, D. J., et al. 2020, ApJ, 895, 31 [NASA ADS] [CrossRef] [Google Scholar]
- Condon, B., Lemoine-Goumard, M., Acero, F., & Katagiri, H. 2017, ApJ, 851, 100 [NASA ADS] [CrossRef] [Google Scholar]
- Condorelli, A., Boncioli, D., Peretti, E., & Petrera, S. 2023, Phys. Rev. D, 107, 083009 [Google Scholar]
- Daum, A., Hermann, G., Heß, M., et al. 1997, Astropart. Phys., 8, 1 [Google Scholar]
- de Naurois, M., & Rolland, L. 2009, Astropart. Phys., 32, 231 [Google Scholar]
- de Vaucouleurs, G. 1973, ApJ, 181, 31 [NASA ADS] [CrossRef] [Google Scholar]
- di Matteo, A., Anchordoqui, L., Bister, T., et al. 2023, Eur. Phys. J. Web Conf., 283, 03002 [Google Scholar]
- Donath, A., Terrier, R., Remy, Q., et al. 2023, A&A, 678, A157 [NASA ADS] [CrossRef] [EDP Sciences] [Google Scholar]
- Ebrahim, R. 2021, MSc Thesis, University of the Witwatersrand [Google Scholar]
- Eichler, D. 1979, ApJ, 232, 106 [Google Scholar]
- Eichmann, B., & Becker Tjus, J. 2016, ApJ, 821, 87 [Google Scholar]
- Eichmann, B., Oikonomou, F., Salvatore, S., Dettmar, R.-J., & Tjus, J. B. 2022, ApJ, 939, 43 [NASA ADS] [CrossRef] [Google Scholar]
- Elmouttie, M., Haynes, R. F., Jones, K. L., Sadler, E. M., & Ehle, M. 1998, MNRAS, 297, 1202 [Google Scholar]
- Fomin, V. P., Stepanian, A. A., Lamb, R. C., et al. 1994, Astropart. Phys., 2, 137 [Google Scholar]
- Freeman, K. C., Karlsson, B., Lynga, G., et al. 1977, A&A, 55, 445 [NASA ADS] [Google Scholar]
- Gaisser, T. K., Halzen, F., & Stanev, T. 1995, Phys. Rep., 258, 173 [NASA ADS] [CrossRef] [Google Scholar]
- Gao, Y., & Solomon, P. M. 2004, ApJ, 606, 271 [NASA ADS] [CrossRef] [Google Scholar]
- García-Burillo, S., Combes, F., Usero, A., et al. 2014, A&A, 567, A125 [Google Scholar]
- Ghez, A. M., Salim, S., Weinberg, N. N., et al. 2008, ApJ, 689, 1044 [Google Scholar]
- Gillessen, S., Eisenhauer, F., Trippe, S., et al. 2009, ApJ, 692, 1075 [NASA ADS] [CrossRef] [Google Scholar]
- Ginzburg, V. L., & Syrovatskii, S. I. 1964, The Origin of Cosmic Rays (Pergamon Press) [Google Scholar]
- Greenhill, L. J., & Gwinn, C. R. 1997, Ap&SS, 248, 261 [Google Scholar]
- Guo, F., & Mathews, W. G. 2012, ApJ, 756, 181 [NASA ADS] [CrossRef] [Google Scholar]
- Guo, X.-L., Xin, Y.-L., Liao, N.-H., & Fan, Y.-Z. 2019, ApJ, 885, 117 [NASA ADS] [CrossRef] [Google Scholar]
- H.E.S.S. Collaboration (Abramowski, A., et al.) 2011, A&A, 533, A103 [NASA ADS] [CrossRef] [EDP Sciences] [Google Scholar]
- H.E.S.S. Collaboration (Abdalla, H., et al.) 2018a, A&A, 619, A71 [NASA ADS] [CrossRef] [EDP Sciences] [Google Scholar]
- H.E.S.S. Collaboration (Abdalla, H., et al.) 2018b, A&A, 617, A73 [NASA ADS] [CrossRef] [EDP Sciences] [Google Scholar]
- H.E.S.S. Collaboration (Abdalla, H., et al.) 2019, A&A, 626, A57 [NASA ADS] [CrossRef] [EDP Sciences] [Google Scholar]
- Hayashida, M., Stawarz, Ł., Cheung, C. C., et al. 2013, ApJ, 779, 131 [NASA ADS] [CrossRef] [Google Scholar]
- Heywood, I., Camilo, F., Cotton, W. D., et al. 2019, Nature, 573, 235 [Google Scholar]
- Hinton, J. A. 2004, New Astron. Rev., 48, 331 [Google Scholar]
- Huré, J. M. 2002, A&A, 395, L21 [NASA ADS] [CrossRef] [EDP Sciences] [Google Scholar]
- IceCube Collaboration (Aartsen, M. G., et al.) 2013, Science, 342, 1242856 [Google Scholar]
- IceCube Collaboration (Aartsen, M. G., et al.) 2018, Science, 361, 147 [NASA ADS] [Google Scholar]
- IceCube Collaboration (Abbasi, R., et al.) 2022, Science, 378, 538 [CrossRef] [PubMed] [Google Scholar]
- IceCube Collaboration (Abbasi, R., et al.) 2023, Science, 380, 1338 [NASA ADS] [CrossRef] [Google Scholar]
- IceCube Collaboration. 2026, ApJ, submitted [arXiv:2602.10208] [Google Scholar]
- Inoue, Y., Khangulyan, D., & Doi, A. 2020, ApJ, 891, L33 [Google Scholar]
- Inoue, S., Cerruti, M., Murase, K., & Liu, R.-Y. 2022, Phys. Rev. Lett., submitted [arXiv:2207.02097] [Google Scholar]
- Inoue, Y., Takasao, S., & Khangulyan, D. 2024, PASJ, 76, 996 [Google Scholar]
- Itoh, T., Done, C., Makishima, K., et al. 2008, PASJ, 60, S251 [Google Scholar]
- Iwasawa, K., Koyama, K., Awaki, H., et al. 1993, ApJ, 409, 155 [NASA ADS] [CrossRef] [Google Scholar]
- Jelley, J. V. 1966, Nature, 211, 472 [Google Scholar]
- Kappes, A., Hinton, J., Stegmann, C., & Aharonian, F. A. 2007, ApJ, 656, 870 [NASA ADS] [CrossRef] [Google Scholar]
- Karachentsev, I. D., Tully, R. B., Dolphin, A., et al. 2007, AJ, 133, 504 [NASA ADS] [CrossRef] [Google Scholar]
- Kataoka, J., Tahara, M., Totani, T., et al. 2013, ApJ, 779, 57 [NASA ADS] [CrossRef] [Google Scholar]
- Kheirandish, A., Murase, K., & Kimura, S. S. 2021, ApJ, 922, 45 [NASA ADS] [CrossRef] [Google Scholar]
- Lacki, B. C., Thompson, T. A., Quataert, E., Loeb, A., & Waxman, E. 2011, ApJ, 734, 107 [NASA ADS] [CrossRef] [Google Scholar]
- Lamastra, A., Fiore, F., Guetta, D., et al. 2016, A&A, 596, A68 [NASA ADS] [CrossRef] [EDP Sciences] [Google Scholar]
- Lenain, J. P., Ricci, C., Türler, M., Dorner, D., & Walter, R. 2010, A&A, 524, A72 [NASA ADS] [CrossRef] [EDP Sciences] [Google Scholar]
- Li, T. P., & Ma, Y. Q. 1983, ApJ, 272, 317 [CrossRef] [Google Scholar]
- Liu, R.-Y., Wang, X.-Y., Inoue, S., Crocker, R., & Aharonian, F. 2014, Phys. Rev. D, 89, 083004 [Google Scholar]
- Lodato, G., & Bertin, G. 2003, A&A, 398, 517 [NASA ADS] [CrossRef] [EDP Sciences] [Google Scholar]
- Malkov, M. A., & Drury, L. O. 2001, Rep. Progr. Phys., 64, 429 [Google Scholar]
- Mancina, S., Silva, M., & IceCube Collaboration 2021, J. Instrum., 16, C09024 [Google Scholar]
- Marconi, A., Moorwood, A. F. M., Origlia, L., & Oliva, E. 1994, The Messenger, 78, 20 [NASA ADS] [Google Scholar]
- Marconi, A., Oliva, E., van der Werf, P. P., et al. 2000, A&A, 357, 24 [NASA ADS] [Google Scholar]
- Marin, F., Churazov, E., Khabibullin, I., et al. 2023, Nature, 619, 41 [Google Scholar]
- Mattox, J. R., Bertsch, D. L., Chiang, J., et al. 1996, ApJ, 461, 396 [Google Scholar]
- Mbarek, R., Philippov, A., Chernoglazov, A., Levinson, A., & Mushotzky, R. 2024, Phys. Rev. D, 109, L101306 [CrossRef] [Google Scholar]
- Michiyama, T., Inoue, Y., Doi, A., & Khangulyan, D. 2022, ApJ, 936, L1 [NASA ADS] [CrossRef] [Google Scholar]
- Murase, K. 2022, ApJ, 941, L17 [NASA ADS] [CrossRef] [Google Scholar]
- Murase, K., Kimura, S. S., & Mészáros, P. 2020, Phys. Rev. Lett., 125, 011101 [Google Scholar]
- Murase, K., Karwin, C. M., Kimura, S. S., Ajello, M., & Buson, S. 2024, ApJ, 961, L34 [NASA ADS] [CrossRef] [Google Scholar]
- Muxlow, T. W. B., Pedlar, A., Holloway, A. J., Gallimore, J. F., & Antonucci, R. R. J. 1996, MNRAS, 278, 854 [NASA ADS] [CrossRef] [Google Scholar]
- Neronov, A., Savchenko, D., & Semikoz, D. V. 2024, Phys. Rev. Lett., 132, 101002 [NASA ADS] [CrossRef] [Google Scholar]
- Ohm, S. 2016, Comptes Rendus Physique, 17, 585 [Google Scholar]
- Parsons, R. D., & Hinton, J. A. 2014, Astropart. Phys., 56, 26 [Google Scholar]
- Peng, F.-K., Zhang, H.-M., Wang, X.-Y., Wang, J.-F., & Zhi, Q.-J. 2019, ApJ, 884, 91 [Google Scholar]
- Peretti, E., Lamastra, A., Saturni, F. G., et al. 2023, MNRAS, 526, 181 [Google Scholar]
- Piano, G., Tavani, M., Vittorini, V., et al. 2012, A&A, 545, A110 [NASA ADS] [CrossRef] [EDP Sciences] [Google Scholar]
- Porter, T. A., Moskalenko, I. V., Strong, A. W., Orlando, E., & Bouchet, L. 2008, ApJ, 682, 400 [NASA ADS] [CrossRef] [Google Scholar]
- Predehl, P., Sunyaev, R. A., Becker, W., et al. 2020, Nature, 588, 227 [CrossRef] [Google Scholar]
- Prokhorov, D. A., & Moraghan, A. 2023, MNRAS, 519, 2680 [Google Scholar]
- Puccetti, S., Comastri, A., Fiore, F., et al. 2014, ApJ, 793, 26 [NASA ADS] [CrossRef] [Google Scholar]
- Punch, M., Akerlof, C. W., Cawley, M. F., et al. 1992, Nature, 358, 477 [NASA ADS] [CrossRef] [Google Scholar]
- Rolke, W. A., López, A. M., & Conrad, J. 2005, Nucl. Instrum. Methods Phys. Res. A, 551, 493 [Google Scholar]
- Sahakyan, N., Yang, R., Aharonian, F. A., & Rieger, F. M. 2013, ApJ, 770, L6 [Google Scholar]
- Strong, A. W., Porter, T. A., Digel, S. W., et al. 2010, ApJ, 722, L58 [NASA ADS] [CrossRef] [Google Scholar]
- Su, M., Slatyer, T. R., & Finkbeiner, D. P. 2010, ApJ, 724, 1044 [Google Scholar]
- Thompson, T. A., Quataert, E., & Waxman, E. 2007, ApJ, 654, 219 [NASA ADS] [CrossRef] [Google Scholar]
- Tikhonov, N. A., & Galazutdinova, O. A. 2021, Astrophys. Bull., 76, 255 [CrossRef] [Google Scholar]
- Tully, R. B., Rizzi, L., Shaya, E. J., et al. 2009, AJ, 138, 323 [NASA ADS] [CrossRef] [Google Scholar]
- Vainshtein, L. A., & Syunyaev, R. A. 1980, Sov. Astron. Lett., 6, 353 [Google Scholar]
- VERITAS Collaboration (Acciari, V. A., et al.) 2009, Nature, 462, 770 [NASA ADS] [CrossRef] [Google Scholar]
- Wang, X., & Fields, B. D. 2018, MNRAS, 474, 4073 [Google Scholar]
- Wilson, A. S., & Ulvestad, J. S. 1982, ApJ, 263, 576 [NASA ADS] [CrossRef] [Google Scholar]
- Wilson, A. S., Shopbell, P. L., Simpson, C., et al. 2000, AJ, 120, 1325 [NASA ADS] [CrossRef] [Google Scholar]
- Wojaczyński, R., & Niedźwiecki, A. 2017, ApJ, 849, 97 [Google Scholar]
- Xi, S.-Q., Liu, R.-Y., Wang, X.-Y., et al. 2020, ApJ, 896, L33 [NASA ADS] [CrossRef] [Google Scholar]
- Xiang, Y.-C., Jiang, Z.-J., & Tang, Y.-Y. 2021, Res. Astron. Astrophys., 21, 263 [Google Scholar]
- Yoast-Hull, T. M., Gallagher, I., J. S., Zweibel, E. G., & Everett, J. E. 2014, ApJ, 780, 137 [Google Scholar]
- Yoast-Hull, T. M., Gallagher, J. S., & Zweibel, E. G. 2016, MNRAS, 457, L29 [NASA ADS] [CrossRef] [Google Scholar]
- Yu, S., Kheirandish, A., Liu, Q., & Niederhausen, H. 2023, 38th International Cosmic Ray Conference (ICRC2023) [Google Scholar]
- Zhang, B. T., Murase, K., Kimura, S. S., Horiuchi, S., & Mészáros, P. 2018, Phys. Rev. D, 97, 083010 [Google Scholar]
- Zubovas, K., & Nayakshin, S. 2012, MNRAS, 424, 666 [NASA ADS] [CrossRef] [Google Scholar]
These ULs are not very sensitive to the choice of the photon index.
The LAT spectral points taken from 4FGL-DR4 and shown in Figs. 2 and 3 are consistent with the results from Murase et al. (2024), but obtained at a marginally higher significance level of  vs.
vs.  for the Circinus galaxy and
  vs.
vs.  for NGC 4945.
The calorimetric γ-ray luminosity limit here assumes an average CR acceleration energy per SN of 3 × 1050 erg.
All Tables
All Figures
|
Fig. 1. Flux upper limits obtained from H.E.S.S. observations of NGC 1068. This figure also shows MAGIC flux upper limits (Acciari et al. 2019) along with a Fermi-LAT data bow tie and an 0.1-1 TeV data point from the Fermi-LAT catalog (Abdollahi et al. 2022). Models A and B show the absorbed γ-ray flux from the neutrino source (see Sect. 4.2). A model for jet-driven bubbles (Sect. 4.1.1) is provided. The calorimetric bound is also shown. |
| In the text | |
|
Fig. 2. Flux upper limits from H.E.S.S. observations of the Circinus galaxy. This figure also shows a Fermi-LAT data bow tie and an 0.1–1 TeV data point from the Fermi-LAT catalog (Abdollahi et al. 2022). A model involving gamma-ray emitting lobes is shown for different values of a spectral break. |
| In the text | |
|
Fig. 3. Flux upper limits obtained from H.E.S.S. observations of NGC 4945. The calorimetric bound is from Wang & Fields (2018); Models 1 and 2 are from Wojaczyński & Niedźwiecki (2017) and Xiang et al. (2021), respectively. |
| In the text | |
Current usage metrics show cumulative count of Article Views (full-text article views including HTML views, PDF and ePub downloads, according to the available data) and Abstracts Views on Vision4Press platform.
Data correspond to usage on the plateform after 2015. The current usage metrics is available 48-96 hours after online publication and is updated daily on week days.
Initial download of the metrics may take a while.