Fig. 1.
Download original image
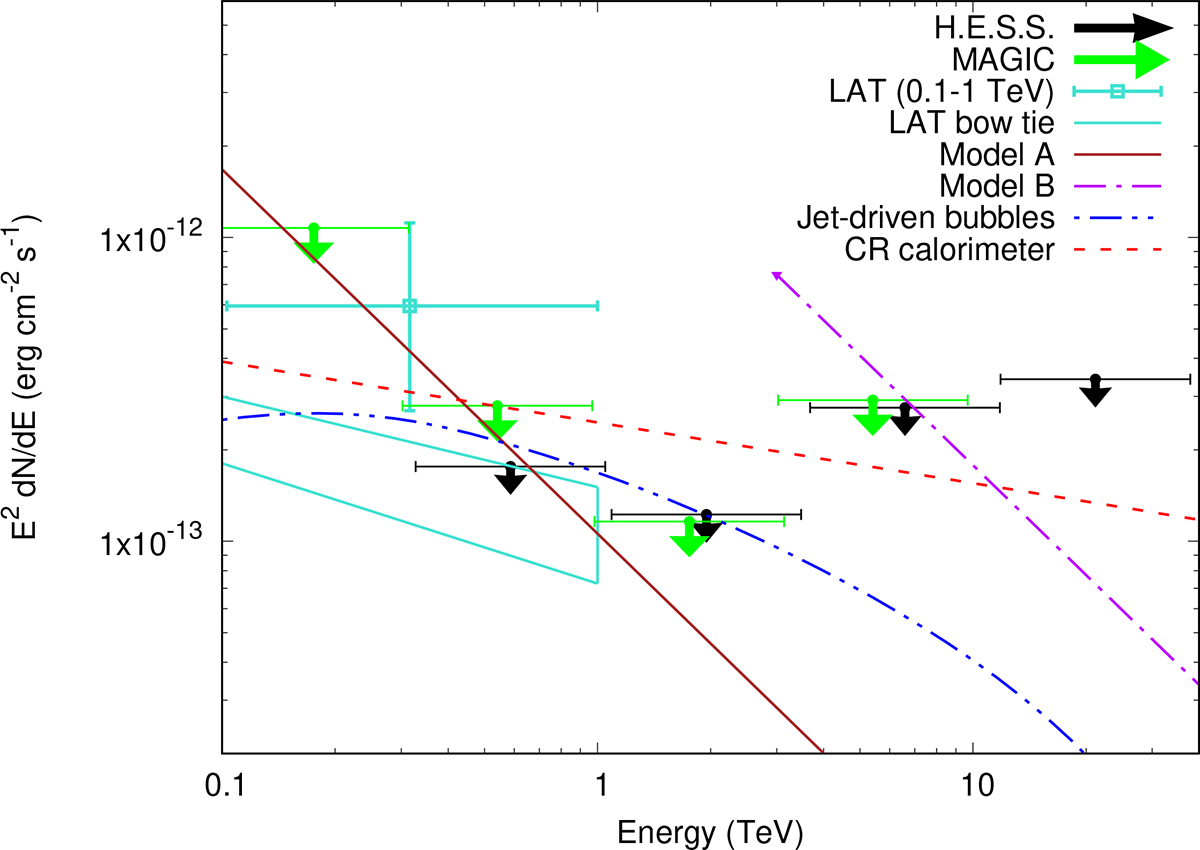
Flux upper limits obtained from H.E.S.S. observations of NGC 1068. This figure also shows MAGIC flux upper limits (Acciari et al. 2019) along with a Fermi-LAT data bow tie and an 0.1-1 TeV data point from the Fermi-LAT catalog (Abdollahi et al. 2022). Models A and B show the absorbed γ-ray flux from the neutrino source (see Sect. 4.2). A model for jet-driven bubbles (Sect. 4.1.1) is provided. The calorimetric bound is also shown.
Current usage metrics show cumulative count of Article Views (full-text article views including HTML views, PDF and ePub downloads, according to the available data) and Abstracts Views on Vision4Press platform.
Data correspond to usage on the plateform after 2015. The current usage metrics is available 48-96 hours after online publication and is updated daily on week days.
Initial download of the metrics may take a while.