| Issue |
A&A
Volume 708, April 2026
|
|
|---|---|---|
| Article Number | A365 | |
| Number of page(s) | 12 | |
| Section | Astrophysical processes | |
| DOI | https://doi.org/10.1051/0004-6361/202558822 | |
| Published online | 24 April 2026 | |
Studying X-ray spectra from large-scale jets of Fanaroff–Riley type I radio galaxies: Application of shear particle acceleration
1
Guangxi Key Laboratory for Relativistic Astrophysics, School of Physics Science and Technology, Guangxi University, Nanning 530004, China
2
Max Planck Institute for Plasma Physics, Boltzmannstraße 2, D-85748 Garching, Germany
3
Institute for Theoretical Physics, University of Heidelberg, Philosophenweg 12, D-69120 Heidelberg, Germany
★ Corresponding authors: This email address is being protected from spambots. You need JavaScript enabled to view it.
; This email address is being protected from spambots. You need JavaScript enabled to view it.
; This email address is being protected from spambots. You need JavaScript enabled to view it.
Received:
30
December
2025
Accepted:
11
March
2026
Abstract
Shear acceleration is a promising candidate mechanism for particle acceleration in extragalactic relativistic jets. For this study, we explored the application of the shear acceleration model to 17 X-ray-bright jet regions in the large-scale jets of Fanaroff–Riley (FR) type I radio galaxies. We studied the jet properties by fitting the multiwavelength spectral energy distributions (SEDs) in a leptonic framework including synchrotron radiation and inverse-Compton scattering off the cosmic microwave background photons. In order to improve spectral modeling, we analyzed Fermi-LAT data for four sources and reanalyzed archival data of Chandra on three X-ray-bright jet regions. We show that synchrotron radiation from a second, shear-accelerated electron population reaching multi-TeV energies satisfactorily models the X-ray SEDs. We explored three different velocity profiles, including linearly decreasing, power-law, and Gaussian profiles and we find that the inferred jet spine velocities are significantly dependent on the choice of velocity profile. The derived magnetic field strengths range from a few to several tens of μG, and the required power in nonthermal particles is well below the Eddington constraint. For M 87, we find that the summed emission from all jet knots is comparable to H.E.S.S. low-state flux, suggesting that the large-scale jet may play a dominant role for the persistent very high energy emission. A comparison with previous results for FR II jets shows that FR I jets tend to have stronger magnetic fields but lower total electron energy. The larger shear viscosity (slower flows and softer shear electron spectral indices) of FR I jets may imply enhanced entrainment and stronger jet-environment interactions compared to FR II jets. Finally, we discuss the potential contribution of FR I jets to ultra-high-energy cosmic rays.
Key words: acceleration of particles / radiation mechanisms: non-thermal / galaxies: jets / X-rays: galaxies
© The Authors 2026
 Open Access article, published by EDP Sciences, under the terms of the Creative Commons Attribution License (https://creativecommons.org/licenses/by/4.0), which permits unrestricted use, distribution, and reproduction in any medium, provided the original work is properly cited.
This article is published in open access under the Subscribe to Open model. This email address is being protected from spambots. You need JavaScript enabled to view it. to support open access publication.
1. Introduction
Radio galaxies are characterized by large-scale radio emission extending from kiloparsec (kpc) to megaparsec (Mpc) scales well beyond their visible structure. Jets in radio galaxies transport mass and energy from the central supermassive black holes (SMBHs). Based on the morphology of the large-scale radio emission, radio galaxies have been classified into low-power Fanaroff–Riley type I (FR I) and high-power Fanaroff–Riley type II (FR II) sources (Fanaroff & Riley 1974). These large-scale FR-type jets can be bright, not only in the optical and X-ray bands (Harris & Krawczynski 2006), but also in the γ-ray band (H. E. S. S. Collaboration 2020), making them ideal laboratories for studying jet dynamics, energy dissipation, and radiation mechanisms (Blandford et al. 2019).
For many years, the preferred explanation for the unusually high X-ray flux observed in most jets of radio galaxies was inverse-Compton (IC) upscattering of cosmic microwave background (CMB) photons up to X-ray energies by a jet that remained highly relativistic on kpc scales (Tavecchio et al. 2000; Celotti et al. 2001). However, this explanation predicts a well-defined, very high level of γ-ray emission (Georganopoulos et al. 2006), which has not been detected in several sources, for example PKS 0637–752 (Meyer et al. 2015, 2017), PKS 1136–135, PKS 1229–021, PKS 1354+195, and PKS 2209+080 (Breiding et al. 2017). In addition, the X-ray emission in jets observed with Chandra is inconsistent with the IC-CMB model, such as the observed X-ray variability and jet-to-counterjet flux ratio in Pictor A (Hardcastle et al. 2016), the spatial offset between radio and X-ray emission and the jet-to-counterjet flux ratio in 3C 353 (Kataoka et al. 2008), and the displacement between radio and X-ray knots in 3C 111 (Clautice et al. 2016). These results contradict the IC-CMB scenario and instead point to an electron-synchrotron origin for the X-ray emission. This interpretation is further supported by the High Energy Stereoscopic System (H.E.S.S.) detection of extended TeV emission from the kpc-scale jet of Centaurus A, confirming the presence of ultrarelativistic electrons (H. E. S. S. Collaboration 2020). Further, multiwavelength studies have revealed significant spectral discrepancies. In particular, the observed spectral indices in the radio, optical, and X-ray bands of sources such as M 87 (Wilson & Yang 2002), 3C 346 (Worrall & Birkinshaw 2005), and 3C 120 (Harris et al. 2004) cannot be explained simultaneously by synchrotron radiation of a single population of electrons, implying the existence of multiple populations of electrons in different regions or at different energies within the jets (Hardcastle et al. 2016).
Synchrotron X-ray emission requires electrons to reach energies of approximately 100 TeV. These electrons lose energy within a few thousand years in a typical 10 μG magnetic field, limiting their propagation to several hundred parsecs. To explain the extended X-ray emission in FR I jets, jets must continuously reaccelerate particles through a distributed mechanism (Wang et al. 2021). One promising mechanism to explain the ultraviolet (UV) to X-ray emission is shear particle acceleration (Liu et al. 2017; Rieger 2019; Wang et al. 2021; Tavecchio 2021). In fast shearing flows, particles can gain energy by elastically scattering off small-scale magnetic field inhomogeneities embedded in velocity-shearing layers. The associated diffusive particle transport framework is broad and encompasses particle acceleration in accelerating, rotating, and/or expanding sheared outflows (Webb 1989; Earl et al. 1988; Webb et al. 1994; Rieger & Mannheim 2002). Its relativistic generalization can, in some cases, be thought of as a pitch-angle-averaged version of the corresponding pitch-angle diffusion equation for cosmic rays in relativistic flows (Webb 1985). Within this framework, shear acceleration can in principle be understood as a stochastic Fermi-type particle acceleration mechanism (Rieger & Duffy 2004; Rieger et al. 2007; Liu et al. 2017; Lemoine 2019; Rieger 2019). The accelerated particle spectra and achievable maximum energies have been extensively studied, and found to mainly depend on the velocity profile and turbulence spectrum (e.g., Liu et al. 2017; Webb et al. 2018, 2020, 2023; Rieger & Duffy 2019, 2021, 2022, 2025; Wang et al. 2021, 2023; Wan et al. 2026). While shear acceleration has been explored and successfully applied to interpret the X-ray knots in several FR II sources (e.g., Wang et al. 2021; He et al. 2023), its application to the population of FR I jets remains relatively unexplored. Velocity-shearing flows are also expected to arise naturally in FR I jets. Observationally, high-resolution radio maps and optical polarization measurements have revealed evidence for lateral velocity structures in several low-power jets including 3C 31 (Laing et al. 2003), NGC 315 (Laing et al. 2006b), B2 0326+39, and 3C 296 (Laing & Bridle 2008), indicating the presence of transverse velocity gradients. In FR I radio galaxies, slower and more turbulent jets are more likely to develop shear layers through interactions with the surrounding medium (Bicknell 1995). Numerical simulations of low-power jets further support this view, demonstrating that a velocity-shearing profile can be naturally self-generated by the interaction between the jet and the ambient medium (Wang et al. 2023, 2024). Therefore, FR I jets can provide favorable environments for shear acceleration processes.
Wang et al. (2021) obtained the exact solution for the steady-state particle spectrum in the presence of synchrotron losses, based on a spatially averaged Fokker-Planck approach, and used it to successfully reconstruct the observed, diffuse X-ray emission in two exemplary sources: the kpc-scale jet in Cen A (FR I type) and the knots A+B1 and C2 in the jet of 3C 273 (FR II type). He et al. (2023) further extended the application to FR II radio galaxies. In this paper, we further explore the application of the shear acceleration model to the X-ray-bright regions in FR I jets and investigate the jet properties by modeling their multiwavelength data. In Section 2, we review the basic information of the sources and describe the details of the data analysis process, presenting the spectral properties of the X-ray and γ-ray emission. In Section 3, we present the spectral energy distribution (SED) modeling within the shear acceleration model. In Section 4, we present the fitting results of the shear acceleration model and discuss their implications. A summary and discussion are provided in Section 5.
2. Data
We selected nine FR I radio galaxies from the Chandra X-ray jet catalog1. These sources were chosen based on their clear and well-defined structures, as well as the availability of multiwavelength coverage from radio to X-rays. The sources include 3C 15, 3C 66B, M 84, 3C 264, M 87, 3C 31, NGC 4261, 3C 296, and 3C 346. We present detailed information and characteristics of these sources as follows.
3C 15: 3C 15 is a well-studied FR I radio galaxy, known for its distinct multiwavelength observational data. A previous study has investigated the X-ray emission from the knots in its jet (Kataoka et al. 2003). The galaxy hosts a SMBH with a mass of ∼6.46 × 10⁸ M⊙ (Bettoni et al. 2003), where M⊙ is the mass of the sun. The redshift of 3C 15 is z = 0.073, which corresponds to an angular scale of 1″ ≈ 1.25 kpc for the adopted cosmology (Kataoka et al. 2003). The nucleus and jets are surrounded by lobe emission, which extends to 50″ (a projected distance of 63 kpc). Previous work has estimated the jet viewing angle to be θ = 50° (Dulwich et al. 2007). The radio-to-optical data are taken from Kataoka et al. (2003).
3C 66B: 3C 66B is an elliptical radio galaxy located in the constellation Andromeda. At a redshift of z = 0.0215, this FR I radio galaxy exhibits a prominent radio jet extending up to 100 kpc (Fraix-Burnet 1997; Iguchi et al. 2010). The X-ray jet is detected up to 7″ from the core and has a steep X-ray spectrum. At this redshift, 1″ corresponds to 0.61 kpc (Hardcastle et al. 2002). The jet of 3C 66B is inclined at an angle of approximately 45° to the line of sight (Giovannini et al. 2001). Observations indicate the presence of a very close binary black hole system, characterized by an orbital period of 1.05 ± 0.03 yr, a primary black hole mass of 1.2 × 10⁹ M⊙, and a secondary black hole mass of 7.0 × 10⁸ M⊙, which could induce a helical structure in the jet (Sudou et al. 2003; Iguchi et al. 2010). The data from radio to X-ray are taken from Hardcastle et al. (2002). The SED data in the γ-ray band are obtained from Tavecchio & Ghisellini (2009).
M 84: M 84 is a very well-studied galaxy, being one of the four prominent ellipticals in the Virgo cluster (z = 0.00339, D = 18.5 Mpc), where 1″ corresponds to approximately 89 pc (Meyer et al. 2018). The galaxy hosts a weak FR I type radio jet, along with a counterjet of nearly the same length and luminosity, suggesting a source which is nearly in the plane of the sky. Optically the nucleus is classified as a low-ionization nuclear emission-line region, and the jet and surroundings have been extensively studied in the radio and X-rays (Meyer et al. 2018). The X-ray emission from the northern part of its jet can extend up to 300 pc (Harris et al. 2002). The central SMBH of M 84 is estimated to have a mass of ∼8.5 × 10⁸ M⊙ (Walsh et al. 2010). The resulting best-fit angle to the line of sight is 74° (Meyer et al. 2018). The radio-to-optical and the γ-ray SED data are obtained from Meyer et al. (2018).
3C 264: The radio source 3C 264, hosted by the giant elliptical galaxy NGC 3862, is one of the nearest bright radio galaxies exhibiting an optical jet and has also been detected at X-ray energies (Perlman et al. 2009). It is one of more prominent active galaxies observed in recent years that can produce high-energy γ-ray emission (Archer et al. 2020). At redshift of z = 0.0217 (1″ = 0.42 kpc), 3C 264 exhibits a bright and collimated radio jet extending to 25″ (∼10 kpc). X-ray and radio observations suggest that the emission from the jet is dominated by synchrotron radiation, hinting at efficient particle acceleration mechanisms (Perlman et al. 2009). The SMBH at the core of 3C 264 has a mass of ∼4.7 × 10⁸ M⊙ (Balmaverde et al. 2008). The viewing angle of the jet is ∼50° (Perlman et al. 2009). The radio through X-ray data were obtained from Perlman et al. (2009), and the γ-ray data are taken from Archer et al. (2020).
M 87: One of the most well-studied FR I radio galaxies, M 87 (NGC 4486) resides in the Virgo cluster at z = 0.0043. The viewing angle of M 87 is approximately between 10° and 25° (Biretta et al. 1999). Its jet, extending approximately 1.6 kpc in the X-ray band (Marshall et al. 2002), has been observed in multiple wavelengths, revealing complex structures and knotty features. The central SMBH, with a mass of ∼6.5 × 10⁹ M⊙, was the subject of the first direct imaging of a black hole’s event horizon (Event Horizon Telescope Collaboration 2019). The radio data are from Giroletti et al. (2012), we also use the published optical-near-infrared data from Perlman et al. (2001), and the UV data from Waters & Zepf (2005) for knots D, E, F, I, A, B, and C. The X-ray data are obtained from Sun et al. (2018). The γ-ray data come from the papers (Cao et al. 2024; Acciari et al. 2020; Zhang et al. 2018; H. E. S. S. Collaboration 2024).
3C 31: This FR I radio galaxy, located at z = 0.0169, has a jet extending over 1.1 Mpc in the 145-MHz map (Heesen et al. 2017), making it one of the most extended sources in our sample. Detailed radio and X-ray observations suggest the presence of shocks and interactions within the jet, consistent with models of jet-environment interaction (Hardcastle et al. 2002). Distances from the nucleus are measured along the tail flow direction, accounting for bends, and corrected for an inclination angle to the line of sight of θ = 52° (Laing & Bridle 2002). The SMBH at the center of 3C 31 is estimated to be ∼4.17 × 10⁸ M⊙ (Bettoni et al. 2003). The radio to X-ray data are taken from Hardcastle et al. (2002).
NGC 4261: NGC 4261 is the brightest known example of counterjet X-ray emission from a low-power radio galaxy. This galaxy has a redshift of z = 0.00746 and is characterized by a well-defined twin-jet system visible in both radio and X-ray bands (Worrall et al. 2010). By combining the apparent motion and the jet-to-counterjet brightness ratio, Piner et al. (2001) derived an inclination angle of θ = 63° ±3°, indicating that the jets lie close to the plane of the sky and suffer only modest Doppler beaming. The central SMBH has an estimated mass of ∼1.67 × 10⁹ M⊙ (Boizelle et al. 2021). The radio and X-ray data are from Worrall et al. (2010). The γ-ray data come from the Space Science Data Center of the Italian Space Agency, using its online SED Builder tool2.
3C 296: 3C 296 is a well-known FR I radio galaxy hosted by the giant elliptical galaxy NGC 5532, located at a redshift of z = 0.0237 (Hardcastle et al. 2005). It hosts a SMBH at its center, with an estimated mass of approximately 6.3 × 10⁸ M⊙ (Wu et al. 2011). The source exhibits a symmetric twin-jet morphology, with the X-ray jet detected along the northern side, extending from about 2″ to 10″ from the nucleus, corresponding to a projected length of approximately 5 kpc (Hardcastle et al. 2005). Detailed relativistic modeling of the radio emission indicates that the jets are inclined at an angle of θ = 58° to the line of sight and decelerate from initial velocities of β ∼ 0.8 to β ∼ 0.4 within the inner few kiloparsecs (Laing et al. 2006a). The radio to X-ray data are from Hardcastle et al. (2005).
3C 346: 3C 346 is a narrow-line radio galaxy located at a redshift of z = 0.161 (Worrall & Birkinshaw 2005). It is hosted by a 17th-magnitude elliptical galaxy, whose central SMBH has an estimated mass of approximately 7.76 × 10⁸ M⊙ (Wu et al. 2011). The kpc-scale jet exhibits a highly distorted morphology, with a notable 70° kink at its brightest knot (Worrall & Birkinshaw 2005). Observations across radio, optical and X-ray wavelengths suggest that the jet’s X-ray emission mechanism is likely dominated by synchrotron emission, and the spectrum is inconsistent with a one-component continuous-injection model (Worrall & Birkinshaw 2005). The angle between the jet direction and our line of sight is approximately 14°, enhancing its observed brightness due to relativistic beaming (Dulwich et al. 2009). The radio to X-ray data are from Worrall & Birkinshaw (2005).
2.1. Chandra data analysis
We used the X-ray data obtained from the Chandra X-ray Observatory, launched by NASA on July 23, 1999. The Chandra X-ray Observatory provides an angular resolution better than 0.5″ and primarily operates in the 0.1–10 keV energy band. This makes it particularly well-suited for detailed observations of high-energy astrophysical objects such as quasars, active galactic nuclei (AGNs), and radio galaxies (Weisskopf et al. 2002). The Chandra X-ray Observatory consists of several key components, among which the two focal plane instruments are the CCD Imaging Spectrometer (ACIS) and the High-Resolution Camera. In this study, we employed X-ray observational data obtained with the ACIS detector for spectral analysis. The spectral extraction was performed using the CIAO (v4.16) software and the Chandra Calibration Database (CALDB, v4.11.1). Owing to the accumulated exposure and the enhanced software tools of Chandra we performed an improved analysis for two sources 3C 15 and M 84 to derive more accurate spectrometric information. The observational information of the two FR I radio galaxies is shown in Table A.1 (see Appendix A). The Chandra data can be searched and downloaded from the official website3. The standard data processing procedures are available at ScienceThreads4. First, we reprocessed the downloaded files using the chandra_repro script. To minimize positional deviations between different observations, we performed astrometric corrections. The fluximage and mkpsfmap tools were used to generate the count images, exposure maps, and weighted PSF maps. The position of the target source was determined using the wavedetect tool. For objects with multiple observations, we cross-matchde the reference observation with other observations, generating the transformation matrix and other parameters using the wcs_match tool. We selected the observation with the longest exposure as the reference to correct the coordinates of the shorter observations. We then used the wcs_update tool to update the aspect solution file and event file, and to generate corrected count images, exposure maps, and weighted PSF maps.
For spectral analysis, the target source and background regions were selected using the ds9 software, specifying their positions, lengths, and widths. The locations of the selected regions, the corresponding length and width (Lknot and Wknot) of the knot are listed in Table A.2 (see Appendix A), where Lknot is the half width at half maximum along the jet, Wknot is the half width at half maximum transverse to the jet. We used the specextract tool to extract spectra for each selected region, generating auxiliary response files, response matrix files, and spectrum files. Subsequently, we used sherpa package to perform simultaneous broadband fitting of multiple observations from the selected regions. We adopted a single power-law model with Galactic absorption and set the hydrogen column density as a fixed parameter. We generally extracted the fluxes in the 0.5–7.0 keV energy band, and the calculated flux errors and photon index errors are at 90 percent confidence level. The X-ray flux densities and reduced chi-square χ2 are listed in Table 1. Through the above steps, we obtained the X-ray fluxes and statistical uncertainties in the soft (0.5–1.2 keV), medium (1.2–2.9 keV), and hard (2.9–7.0 keV) bands, as well as the best-fit spectral indices with uncertainties.
Reanalyzed X-ray flux of the knots for different energy bands.
2.2. Fermi data analysis
The Fermi Large Area Telescope (Fermi-LAT), launched on 11 June 2008, is a wide field-of-view imaging γ-ray telescope sensitive to photons in the energy range from 20 MeV to 300 GeV (Atwood et al. 2009). In this work, we selected Fermi-LAT Pass 8 data around the sources 3C 15, 3C 31, 3C 296, and 3C 346 regions. The observation periods for each source are listed in Table 2. For each target, we defined a 5° ×5° square region centered on the source coordinates as the region of interest (ROI). Photon events were selected in the energy range from 500 MeV to 10 GeV. We adopted the event class SOURCE, and the event type Front+Back (evclass = 128, evtype = 3). A zenith angle cut of < 90° was applied to reduce contamination from the Earth’s albedo. Data quality cuts applied the recommended expression (DATA_QUAL > 0) && (LAT_CONFIG == 1). The analysis used the instrument response function P8R3_SOURCE_V3 throughout. We applied the Python module that implements a maximum likelihood optimization technique for a standard binned analysis. Diffuse background emission was modeled using the Galactic diffuse template gll_iem_v07.fits and the isotropic component iso_P8R3_SOURCE_V3_v1.txt5. XML model files for all sources within the ROI and within an extra 5° radius are generated using the Python script make4FGLxml.py6, based on the 4FGL catalog.
γ-ray flux of sources.
Data preprocessing was performed using the Fermitools pipeline, including the tasks gtselect, gtmktime, gtltcube, gtexpcube2, and gtsrcmaps, which are required for likelihood analysis. We performed binned maximum likelihood fitting using gtlike to derive the spectral properties of each source. We modeled the target source as a point-like emitter with a power-law spectrum. To extract the SED, we divided the energy range into three logarithmically spaced bins and performed a maximum likelihood fit within each energy bin. The specific results are presented in Table 2.
3. SED modeling and fitting
In the shear acceleration model, the observed radio to X-ray emission is explained by synchrotron radiation generated by two populations of electrons (Wang et al. 2021). The lower-energy electrons contribute primarily to the radio and optical bands, likely accelerated through mechanisms such as shock acceleration or second-order Fermi processes (e.g., Rieger et al. 2007; Liu et al. 2017). The UV-to-X-ray emission is attributed to a higher-energy electron population energized by shear acceleration. The shear-accelerated electrons remain primarily confined to the jet sheath region, whereas the low-energy population can occupy the entire jet region. This can lead to the formation of two distinct electron populations rather than a single broken-power-low distribution. Therefore, in this paper, we mainly considered the scenario involving two electron populations.
For the low-energy electron distribution with energy E ≥ Emin1, we adopted an exponential-cut-off power-law shape,
![Mathematical equation: $$ \begin{aligned} N_1(E) = A_1\left(\frac{E}{E_0}\right)^{-\alpha _1}\exp \left[-\left(\frac{E}{E_{\rm cutoff1}}\right)^2\right], \end{aligned} $$](/articles/aa/full_html/2026/04/aa58822-25/aa58822-25-eq3.gif) (1)
(1)
where A1 is the normalization factor, α1 is the spectral index, Ecutoff1 is the cutoff energy, and E0 is fixed at 1 TeV. Emin1 is the minimum energy of the low-energy electron.
For the high-energy electron population with energy E ≥ Emin2, we adopted the spatially averaged Fokker–Planck transport equation to describe shear acceleration, radiative losses, and particle escape (Rieger et al. 2007; Liu et al. 2017; Wang et al. 2021), which can be written as
![Mathematical equation: $$ \begin{aligned} \frac{\partial n(\gamma , t)}{\partial t}&= \frac{1}{2} \frac{\partial }{\partial \gamma }\left[\left\langle \frac{\Delta \gamma ^{2}}{\Delta t}\right\rangle \frac{\partial n(\gamma , t)}{\partial \gamma }\right] \nonumber \\&\quad -\frac{\partial }{\partial \gamma }\left[\left(\frac{1}{\gamma }\left\langle \frac{\Delta \gamma ^{2}}{\Delta t}\right\rangle -\left\langle \dot{\gamma }_{\mathrm{c} }\right\rangle \right) n(\gamma , t)\right]-\frac{n(\gamma , t)}{\tau _{\mathrm{esc} }}+Q(\gamma , t), \end{aligned} $$](/articles/aa/full_html/2026/04/aa58822-25/aa58822-25-eq4.gif) (2)
(2)
where ⟨Δγ2/Δt⟩ ∝ γ4 − q denotes the momentum diffusion coefficient associated with shear acceleration,  represents the radiative cooling rate including synchrotron radiation and IC scattering in the Thomson regime, τesc ∝ γq − 2 is the escape timescale, q is the turbulence spectral index and Q(γ, t) is the particle injection term. Following Wang et al. (2021), we further assumed that seed particles are preaccelerated and injected below a critical energy γmin2, so that the injection term vanishes (Q(γ, t) = 0) for the high-energy particle population (γ > γmin2) considered here. Under the steady-state condition (∂n/∂t = 0), the solution can be written in terms of the particle energy E = γmec2 as
 (3)
(3)
where the indices α± are defined as
 (4)
(4)
with q being the turbulent spectrum index and w is a dimensionless measure of the shear viscosity. Here we adopted a Kolmogorov-type turbulence spectrum q = 5/3, which is in general consistent with numerical simulations (Wang et al. 2023). The functions F±(E, q) are defined as
 (5)
(5)
where Ee, max is the maximum energy electrons can reach in the presence of cooling, and 1F1 is the Kummer’s confluent hypergeometric function (Abramowitz & Stegun 1972).
In shear flows, the efficiency of particle acceleration generally depends on the underlying flow velocity profile. Here we explored three different velocity profiles. As a first approach, we considered a simplified linear shear velocity profile in which the velocity of the jet decreases linearly with radius, expressed as (Rieger & Duffy 2022)
![Mathematical equation: $$ \begin{aligned} \beta (r) = \beta _{0,l} \left[1 - \left(\frac{r}{R_{\rm jet}}\right)\right], \end{aligned} $$](/articles/aa/full_html/2026/04/aa58822-25/aa58822-25-eq9.gif) (6)
(6)
where β0, l is the velocity along the jet axis and Rjet denotes the jet radius.
Following Wang et al. (2023), the shear viscosity parameter w is determined by the region Δr that confines the particles and the local flow velocity profile β(r), which is defined as
 (7)
(7)
where Γ(r) is the local jet-flow Lorentz factor. By averaging this expression over the shear layer (Wang et al. 2023), the dimensionless shear parameter wl for the adopted linear profile becomes
![Mathematical equation: $$ \begin{aligned} w_l = \frac{10 \beta _{0,l}^{2}}{\left[\zeta \ln (1 - \beta _{0,l}^{2}) + 2 \beta _{0,l} \tanh ^{-1}(\beta _{0,l})\right]^2}, \end{aligned} $$](/articles/aa/full_html/2026/04/aa58822-25/aa58822-25-eq11.gif) (8)
(8)
where ζ = Wsh/Rjet represents the ratio of the shear layer width to the jet radius. Numerical simulations suggest that ζ ∼ 1/2 for FR I jets. Here Rjet = Wknot denotes the jet radius, and Wsh is the width of the shearing region.
As a second case, we considered a power-law type velocity profile where the jet velocity decreases with radius as (Rieger & Duffy 2022),
 (9)
(9)
where β0, p represents the velocity along the jet spine. This form has been widely adopted in simulations and theoretical studies. It reflects a more gradual velocity gradient near the jet boundary, providing a more realistic description of astrophysical jets. In this scenario, the corresponding shear viscosity parameter w takes the form Rieger & Duffy (2022),
![Mathematical equation: $$ \begin{aligned} w_p = \frac{(6 - q)\, t_{\rm acc}}{t_{\rm esc}} = 116 \langle \beta \rangle \left[ \ln \left(\frac{1 + \Delta \beta }{1 - \Delta \beta } \right) \right]^{-2}, \end{aligned} $$](/articles/aa/full_html/2026/04/aa58822-25/aa58822-25-eq13.gif) (10)
(10)
where  is the relativistic relative velocity between the jet spine and its outer edge. The quantity ⟨β⟩ is the spatially averaged jet velocity across the radius, defined as
 (11)
(11)
For a Gaussian velocity profile as (Rieger & Duffy 2022)
 (12)
(12)
where β0, g denotes the spine velocity, for the Gaussian profile, the boundary velocity is negligible, i.e., β(Rjet) = 0, such that Δβ ≃ β0, g, w is also of the form in Rieger & Duffy (2022),
![Mathematical equation: $$ \begin{aligned} w_g = 116 \langle \beta \rangle \left[ \ln \left(\frac{1 + \beta _{\rm 0, g}}{1 - \beta _{\rm 0, g}} \right) \right]^{-2}. \end{aligned} $$](/articles/aa/full_html/2026/04/aa58822-25/aa58822-25-eq17.gif) (13)
(13)
As the spine velocity β0, lβ0, p, and β0, g approaches the speed of light (β → 1), the shear parameter w tends to zero. Consequently, the spectral index of the shear-accelerated electrons approaches α− = 3 − q = 4/3. The foregoing limiting result indicates that in ultra-relativistic flows, the resulting spectral index becomes nearly independent of the specific velocity profile (Webb et al. 2018, 2019; Rieger & Duffy 2019, 2022).
The maximum electron energy Ee, max and the corresponding maximum synchrotron photon energy Eγ,max are determined by the requirement that two conditions are simultaneously satisfied: (1) the particle scattering time is shorter than the acceleration time, ensuring effective energy gain for a mildly relativistic flow; (2) the acceleration time is shorter than the radiative cooling time, so that particles can be accelerated before significant energy losses occur. The maximum electron and photon energies can be expressed as
 (14)
(14)
 (15)
(15)
where B1 = B/(10 μG), Wsh, 0.1 = Wsh/(0.1 kpc), and f = Urad/UB is the ratio of radiation to magnetic energy density. The external radiation field includes contributions from the cosmic microwave background (CMB), with the radiation energy density given by Urad = 4.13 × 10⁻¹³(1 + z)4 erg cm−3, and the magnetic energy density expressed as UB = B2/(8π).
In fitting the multiwavelength SEDs, we also considered IC scattering off the CMB photons for both electron components. We additionally evaluated the IC contribution from the second electron population scattering off the synchrotron photon field of the first electron population (IC-SyI). For the γ-ray band, we took into account the absorption by extragalactic background light using the model of Domínguez et al. (2011). Due to the limited angular resolution of the Fermi-LAT telescope and ground-based very high energy (VHE) observatories (e.g., MAGIC, H.E.S.S., VERITAS, and LHAASO), it remains uncertain whether the detected γ-ray emission from the target region originates from the jet or the core. Therefore, all γ-ray data (including both the GeV and VHE bands) were only treated as upper limits for the X-ray-bright regions in the modeling.
The SEDs were modeled using the publicly available Python package Naima (Zabalza 2015), which supports Markov Chain Monte Carlo (MCMC) fitting through the emcee sampler (Foreman-Mackey et al. 2013). To reduce the number of free parameters in our model, the minimum energy of the low-energy electron population, Emin, 1 (list in Table A.3), was fixed by matching the synchrotron condition to the lowest frequency of the radio observations, thereby providing a lower limit on its energy content.
This value was applied uniformly across all regions within the same jet. Table A.3 shows the key physical parameters obtained from the spectral fits, including the magnetic field strength B, the cutoff energy Ecutoff, 1 of the low-energy electron component, the spectral index α1, the shear viscosity w, and the total energy content of both electron populations (We, 1 and We, 2). Additionally, the minimum energy Emin, 2 of the high-energy electron component are also listed for each X-ray-bright regions.
4. Results
We applied the shear acceleration model to the multiwavelength observations of 17 X-ray-bright regions of FR I radio galaxies. The best-fit SEDs are presented in Figures 1, 2, and 3. In these figures, the red data points are derived from reprocessed Chandra and Fermi-LAT data, while data points of other colors are adopted from the references. The individual contributions of the two populations are marked with dotted and dashed lines, respectively. The cyan and yellow curves denote synchrotron and IC-CMB radiation, respectively. The blue dashed lines represent the IC-SyI radiation. The solid black line indicates the total modeled emission. The last panel of Figure 1 specifically displays the summed SED of the model-predicted γ-ray emission from all modeled knots in M 87.
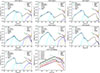 |
Fig. 1. Best-fit SEDs of the X-ray knots in M 87. All data points are taken from the references, see details in Section 2. The dotted lines and dashed lines represent the radiation produced by the low-energy and high-energy electron populations, respectively. The cyan and yellow lines denote synchrotron and IC-CMB radiation, respectively. The dashed blue lines represent the IC contribution from the second electron population scattering off the synchrotron photon field of the first electron population. The solid black lines indicate the total nonthermal emission. In the γ-ray band, measurements from different instruments are denoted by different colors. In the last panel, the solid lines of different colors represent the total IC emission contributions from the different knots, and the black line represents the sum of the emission from all modeled knots. |
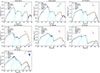 |
Fig. 2. Best-fit SEDs of X-ray-bright jet regions in M 84, 3C 15, 3C 346, 3C 264, 3C 296, and 3C 31. Red data points are from reanalyzed Chandra and Fermi data. In the γ-ray band, points of other colors represent data from instruments other than Fermi-LAT. Data points (except the red ones) are from the references, see details in Section 2. The styles of lines are the same as in Figure 1. |
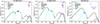 |
Fig. 3. Fitting results and broadband SEDs of the X-ray-bright jet regions in 3C 66B and NGC 4263. The styles of data and lines are the same as in Figure 2. |
We classified the sample of radio galaxies into three groups, based on the coverage of their multiwavelength data sets. The knots in M 87, shown in Figure 1, represent the first group with the most complete multiwavelength data from radio to X-rays. These high-quality multiwavelength data provide strong constraints on the model parameters, resulting in robust parameter constraints. Such comprehensive data provide an ideal basis for testing and validating the shear-acceleration model. The second group includes 3C 15, 3C 346, 3C 264, 3C 296, 3C 31, and M 84, which also have multiwavelength coverage. These sources have fewer data points, particularly in the radio and optical bands where three or more data points are available. As a result, the fitting process yields broader posterior distributions and increased parameter uncertainties. As shown in Figure 2, Knot C of 3C 15, for example, has only three radio-to-optical data points, leading to significantly weaker parameter constraints compared to the first group. The third group consists of NGC 4261 and 3C 66B, which have at most one or two data points from the radio to optical bands. This sparse coverage further weakens the constraints on particle energy distributions and radiative parameters during SED reconstruction. As illustrated in Figure 3, the absence of optical data leads to larger uncertainties in that energy range, particularly for the cutoff energy of the first electron population and the minimum energy of the second.
In Table A.3, we show that the total energy content of the low-energy electron population (We, 1) is larger than that of the high-energy electrons (We, 2) in all cases. In our sample, We, 1 spans the range 3 × 1052 to 2 × 1056 erg, and We, 2 ranges from 5 × 1048 to 6 × 1052 erg. For the low-energy electron population, the spectral index (α1) predominantly lies between 1.8 and 2.7, with a significant clustering around 2.4. The cutoff energy Ecutoff1 generally lies between 1 TeV and 11 TeV. The magnetic field B spans from ∼5 μG to 24 μG. For M 87 and 3C 66B, there are significant magnetic field differences in the knots, possibly caused by local magnetic field amplification from stronger deceleration, shear, or turbulence within the jet (Laing & Bridle 2013; Gaibler et al. 2009). The range of the shear viscosity parameter w is approximately 2–15. The difference in the shear viscous parameter (w) relates to their jet profiles through Eqs. (8) and (10). Regarding the high-energy electron population, Emin2 typically falls within 1–22 TeV.
In Table A.4, we list the dynamical parameters of the jets, including the spine velocity for a power-law profile β0, p, a linear profile β0, l and a Gaussian profile β0, g, as well as the spectral index of the high-energy electron population α−, the maximum electron energy Ee, max, the ratio between the kinetic electron power Pbright and the Eddington luminosity Ledd, Pbright/Ledd, and the Doppler factor δ. The corresponding spectral index α− of the high-energy electron population, derived from Eq. (4), spans the range from approximately 2.0–4.0. Generally, a harder spectrum requires a higher spine velocity, as shown in Table A.4. For the power-law and linearly decreasing velocity distributions, we find that the spine velocities of the jets are mostly consistent with mildly relativistic velocities (i.e., Lorentz factor Γ ≲ 4). In general, the spine velocity derived under the power-law velocity distribution model is slightly larger than the result under the linear velocity distribution model. The spine velocity of the Gaussian model is larger than that of the power-law velocity distribution model. Accordingly, we find that the inferred jet spine velocity is sensitive to the choice of underlying profile. The cutoff energy of the high-energy population can be derived from Eq. (14), and can well exceed 100 TeV in M 87.
In Table A.4, we also show the ratio between the power Pbright and the Eddington luminosity Ledd of the X-ray-bright regions in FR I jets, where Pbright is calculated based on the velocity from the linear profile,
 (16)
(16)
where c is the speed of light. Based on the lowest frequency of the radio observations, we set Emin, 1 ≥ 0.5 GeV. Formally, this provides only a conservative lower limit on the X-ray-bright energetics. If the electron distribution were to extend down to γ ∼ 1, the total energy in low-energy electrons (We, 1) would increase by a factor of roughly 10000.4 ∼ 16 for the inferred spectral index p ≃ 2.4. This suggests that the actual power could be more than an order of magnitude higher than our reported lower limit.
Values of the viewing angle θ for the FR I sources are adopted from the literature. For 3C 15, we use θ = 50°. For NGC 4261 and M 84, we adopt the central values of the viewing angles, θ = 74° and θ = 63°, respectively. The viewing angle information for the other sources is provided in Section 2. The Eddington luminosity Ledd = 1.25 × 1038 (MBH/M⊙) erg s−1 can be obtained using the SMBH masses (MBH) reported in Section 2. For all regions, we find that the power required to reproduce the multiwavelength emission is significantly smaller than the Eddington luminosity, see Table A.4, i.e., Pbright/Ledd ∼ (10−6 − 10−3). The relativistic jet effects and Doppler boosting could be important. We took into account the Doppler factor for all jet regions in our analysis, where δ−1 = Γ(1 − β0, l cos θ) and  .
.
5. Summary and discussion
In this paper, we have systematically studied a large sample of X-ray-bright regions in FR I jets within the gradual shear acceleration framework. By modeling their multiwavelength observations, we derived constraints on key jet properties. We reanalyzed Chandra ACIS data for three regions, including Knot C of 3C 15, and Knot A and B of M 84, taking new observations into account. In addition, we analyzed Fermi-LAT Pass 8 data for four sources, namely, 3C 296, 3C 31, 3C 346, and 3C 15. The X-ray spectra in the 0.5–7 keV energy range can be well fitted with a single power-law model. The X-ray photon indices are around 1.00. A comparison with the radio and optical spectral indices suggests that a single electron population can account for the X-ray emission in some regions, whereas others show clear inconsistencies that require an additional spectral component. Hence, we explored a scenario where two populations of electrons contribute to the observed emission. In particular, we considered the high-energy electron population to be energized by shear acceleration and being responsible for the X-ray emission.
In the two-electron-population model, there are seven main parameters: the total energy (We, 1), spectral index (α1), and cutoff energy (Ecutoff1) of the first electron population, the total energy (We, 2) and minimum energy (Emin, 2) of the second electron population, the shear viscosity parameter (w), and the average magnetic field strength (B), which are defined by Eqs. (1)–(8). We performed a multiwavelength SED fitting using the Naima package. The best-fit distributions and the corresponding uncertainties of these parameters were derived through the MCMC algorithm. Depending on the wavelength coverage in the data set, we divided the sample into three subgroups.
The results of our analysis are summarized in Tables A.3 and A.4, and Figures 1–3. In these FR I jets, the magnetic field strength spans a range of B ∼ (5 − 24) μG. For the high-energy electron population, an injection at Emin2 ∼ (1 − 22) TeV is required and the cutoff energy is typically around some hundreds of TeV. The shear viscous parameter (w) is typically in the range of w ∼ (2 − 15), corresponding to electron spectral indices α− in the range ∼(2.0 − 4.0). For all regions, the power required to produce the multiwavelength emission is significantly lower than the Eddington luminosity, with a ratio of Pbright/LEdd ∼ (10−6 − 10−3). The corresponding spine velocities are in the range β0, l ∼ (0.49 − 0.88) for a linear profile, β0, p ∼ (0.47 − 0.93) for a power-law profile, and β0, g ∼ (0.57 − 0.96) for a Gaussian profile. The derived spine velocities correspond to mildly relativistic large-scale flows with bulk Lorentz factors of Γ ≲ 4. From the jet spine velocities derived under different shear velocity profiles, we find that β0, l, β0, g, and β0, p exhibit some differences. In most cases, the linear velocity β0, l is slightly lower than the power-law velocity β0, p, where we adopt ζ ∼ 1/2 for the linear profile in Eq. (8). However, if we take ζ ∼ 4/5 in Eq. (8), the derived linear spine velocity will be generally larger than the power-law spine velocity. These results indicate that inferred jet spine velocities depend on the adopted velocity profile, introducing systematic uncertainties for inferences based on our current SED modeling. More detailed modeling of the shear acceleration process (e.g., Webb et al. 1994, 2018; Rieger & Duffy 2022) could, in principle, help to further constrain the parameter range, while complementary jet simulations could shed additional light on the flow properties.
The radiative parameters for the knots in M87 are well constrained, which enables the investigation of possible variations among different regions. In its jet, for the low-energy electron population, parameters such as the spectral index α1 and cutoff energy Ecutoff1 show only modest variations across the knots, indicating similar acceleration or cooling processes at low energies. Meanwhile, the derived spine velocities exhibit some fluctuations among different knots, suggesting the presence of localized acceleration or different transverse velocity profiles along the jet while it maintains a relativistic flow on kiloparsec scales. Mildly relativistic speeds are in principle compatible with optical proper motion measurements, with jet helicity potentially introducing local deviations (Meyer et al. 2013). Minor variations in magnetic field strength and Doppler factors may be related to local jet dynamics, which could affect shear acceleration efficiency via changes in velocity profile or particle injection processes. These aspects warrant further investigation in future studies.
Recent observations by H.E.S.S. have characterized the VHE spectrum of M 87 in its low state (H. E. S. S. Collaboration 2024). To investigate the potential contribution of the large-scale jet in the γ-ray band, we compare our model predictions with the observed γ-ray data in the last panel of Figure 1. The black solid line represents the cumulative emission from all the modeled knots. Interestingly, the flux level of this summed component is comparable to the H.E.S.S. low-state data points (plotted in purple). This result suggests that the large-scale jet, energized by shear acceleration, could be the dominant contributor to the persistent, baseline VHE emission in M 87. Furthermore, this mechanism implies that large-scale jets may play a potentially important role in the VHE emission of other radio galaxies. This may be tested by future high-resolution γ-ray telescopes.
In Table 3, we compare the key fitted parameters of representative FR I samples (from the first two groups with better data quality) with those of the FR II sample from He et al. (2023). We show the distribution of the parameters derived for the sample in Figure 4. The spine velocities derived from FR I jets (β0, l ∼ 0.49 − 0.88) are significantly lower than those from FR II jets (β0, l ∼ 0.80 − 0.99), likely related to the significantly lower total energies in both the first and second electron populations of FR I jets compared to FR II jets. The magnetic field strengths in FR I jets (B ∼ 4.6 − 20 μG) are generally higher than those in FR II jets (B ∼ 2.2 − 13 μG). This difference is, however, likely attributable to the dependence of the magnetic field strength on the distance along the jet. Since the FR I knots in our sample are located significantly closer to the central engine (< 5 kpc) than the more distant FR II knots (10> kpc), their magnetic fields are expected to be stronger. In particular, most of the FR II knots reported in He et al. (2023) are located at distances of 10–60 kpc from the nucleus, whereas the FR I knots analyzed in this study are distributed between 0.2 and 5 kpc from the nucleus. In addition, local magnetic field amplification, possibly resulting from stronger deceleration, shear, or turbulence within the jets, may further enhance the fields (Laing & Bridle 2013; Gaibler et al. 2009). FR I jets have a larger shear viscosity parameter (w ∼ 3 − 15) compared to FR II jets (w ∼ 1.8 − 6.6). This trend suggests that FR I jets may experience stronger shear effects, which may be attributed to their enhanced entrainment and interactions with the surrounding medium (Bicknell 1995). The enhanced shear not only contributes to significant local magnetic field amplification but also leads to steeper shear electron spectral indices.
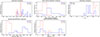 |
Fig. 4. Comparison of the fitted jet parameters for the FR I (blue solid histograms) and FR II (dashed red histograms) samples. The panels show, respectively, (top left) the shear accelerated electron spectral index α, (top middle) the dimensionless shear viscosity parameter w, (top right) the spine velocity β0, l, (bottom left) the magnetic field strength B, and (bottom right) the maximum electron energy Ee, max. |
Comparison of parameters between FR I and FR II.
The jets of AGNs have also been considered as potential sites for ultra-high-energy cosmic-ray (UHECR) acceleration according to the Hillas criterion (Hillas 1984; Aharonian 2002). Although the X-ray-bright regions in FR I jets have lower powers than the knots in FR II jets, the presence of significant velocity gradients and magnetic fields over kiloparsec scales could still facilitate efficient particle acceleration. Applying the same shear acceleration model (Rieger & Duffy 2019), the maximum proton energy achievable in AGN jets is  , where ξ ≤ 1 is the turbulence energy density ratio and Z is the atomic number. For typical magnetic field strengths of B ∼ (5 − 24) μG and shear widths inferred from observations, protons and nuclei in FR I jets can be accelerated up to Ep, max ∼ (0.1 − 4.0)Z EeV in the case of strong turbulence (ξ = 1). Although this energy range is somewhat lower than in powerful FR II radio galaxies, it remains sufficient to contribute to the observed cosmic-ray flux around the light-ankle and the initial ankle regions. These results support the possibility that nearby FR I radio galaxies such as M 87 may play a non-negligible role in the origin of UHECRs (Wang et al. 2024).
Acknowledgments
We gratefully acknowledge the availability of these resources, which make such analyses possible. This work is supported by the Guangxi Science Foundation (grant Nos. 2026GXNSFAA00641075 and 2024GXNSFBA010375), Guangxi Key Research and Development Program (Guike FN2504240040), the National Natural Science Foundation of China (NSFC, grant Nos. 12133003 and 12494573), the Guangxi Talent Program (“Highland of Innovation Talents”), and the Bagui Scholars Programme (W.X.-G., GXR-6BG2424001). We are grateful to J. Zhang for the constructive discussions. The Fermi-LAT data analyzed in this work are publicly available through the Fermi Science Support Center, hosted by NASA-GSFC (https://fermi.gsfc.nasa.gov/cgi-bin/ssc/LAT/LATDataQuery.cgi). The Chandra ACIS observations used in this study were obtained from the Chandra Data Archive (https://cda.harvard.edu/chaser/mainEntry.do), which provides access to all publicly released datasets.
References
- Abramowitz, M., & Stegun, I. A. 1972, Handbook of Mathematical Functions (New York: Dover Publications) [Google Scholar]
- Acciari, V. A., Ansoldi, S., Antonelli, L. A., et al. 2020, MNRAS, 492, 5354 [NASA ADS] [CrossRef] [Google Scholar]
- Aharonian, F. A. 2002, MNRAS, 332, 215 [Google Scholar]
- Archer, A., Benbow, W., Bird, R., et al. 2020, ApJ, 896, 41 [NASA ADS] [CrossRef] [Google Scholar]
- Atwood, W. B., Abdo, A. A., Ackermann, M., et al. 2009, ApJ, 697, 1071 [CrossRef] [Google Scholar]
- Balmaverde, B., Baldi, R. D., & Capetti, A. 2008, A&A, 486, 119 [NASA ADS] [CrossRef] [EDP Sciences] [Google Scholar]
- Bettoni, D., Falomo, R., Fasano, G., & Govoni, F. 2003, A&A, 399, 869 [NASA ADS] [CrossRef] [EDP Sciences] [Google Scholar]
- Bicknell, G. V. 1995, ApJS, 101, 29 [Google Scholar]
- Biretta, J. A., Sparks, W. B., & Macchetto, F. 1999, ApJ, 520, 621 [NASA ADS] [CrossRef] [Google Scholar]
- Blandford, R., Meier, D., & Readhead, A. 2019, ARA&A, 57, 467 [NASA ADS] [CrossRef] [Google Scholar]
- Boizelle, B. D., Walsh, J. L., Barth, A. J., et al. 2021, ApJ, 908, 19 [NASA ADS] [CrossRef] [Google Scholar]
- Breiding, P., Meyer, E. T., Georganopoulos, M., et al. 2017, ApJ, 849, 95 [Google Scholar]
- Cao, Z., Aharonian, F., Axikegu, et al. 2024, ApJ, 975, L44 [Google Scholar]
- Celotti, A., Ghisellini, G., & Chiaberge, M. 2001, MNRAS, 321, L1 [Google Scholar]
- Clautice, D., Perlman, E. S., Georganopoulos, M., et al. 2016, ApJ, 826, 109 [NASA ADS] [CrossRef] [Google Scholar]
- Domínguez, A., Primack, J. R., Rosario, D. J., et al. 2011, MNRAS, 410, 2556 [Google Scholar]
- Dulwich, F., Worrall, D. M., Birkinshaw, M., Padgett, C. A., & Perlman, E. S. 2007, MNRAS, 374, 1216 [Google Scholar]
- Dulwich, F., Worrall, D. M., Birkinshaw, M., Padgett, C. A., & Perlman, E. S. 2009, MNRAS, 398, 1207 [Google Scholar]
- Earl, J. A., Jokipii, J. R., & Morfill, G. 1988, ApJ, 331, L91 [Google Scholar]
- Event Horizon Telescope Collaboration (Akiyama, K., et al.) 2019, ApJ, 875, L1 [Google Scholar]
- Fanaroff, B. L., & Riley, J. M. 1974, MNRAS, 167, 31P [Google Scholar]
- Foreman-Mackey, D., Hogg, D. W., Lang, D., & Goodman, J. 2013, PASP, 125, 306 [Google Scholar]
- Fraix-Burnet, D. 1997, MNRAS, 284, 911 [Google Scholar]
- Gaibler, V., Krause, M., & Camenzind, M. 2009, MNRAS, 400, 1785 [NASA ADS] [CrossRef] [Google Scholar]
- Georganopoulos, M., Perlman, E. S., Kazanas, D., & McEnery, J. 2006, ApJ, 653, L5 [NASA ADS] [CrossRef] [Google Scholar]
- Giovannini, G., Cotton, W. D., Feretti, L., Lara, L., & Venturi, T. 2001, ApJ, 552, 508 [NASA ADS] [CrossRef] [Google Scholar]
- Giroletti, M., Hada, K., Giovannini, G., et al. 2012, A&A, 538, L10 [NASA ADS] [CrossRef] [EDP Sciences] [Google Scholar]
- H. E. S. S. Collaboration (Abdalla, H., et al.) 2020, Nature, 582, 356 [Google Scholar]
- H. E. S. S. Collaboration (Aharonian, F., et al.) 2024, A&A, 685, A96 [NASA ADS] [CrossRef] [EDP Sciences] [Google Scholar]
- Hardcastle, M. J., Birkinshaw, M., & Worrall, D. M. 2001, MNRAS, 326, 1499 [Google Scholar]
- Hardcastle, M. J., Worrall, D. M., Birkinshaw, M., Laing, R. A., & Bridle, A. H. 2002, MNRAS, 334, 182 [Google Scholar]
- Hardcastle, M. J., Worrall, D. M., Birkinshaw, M., Laing, R. A., & Bridle, A. H. 2005, MNRAS, 358, 843 [Google Scholar]
- Hardcastle, M. J., Lenc, E., Birkinshaw, M., et al. 2016, MNRAS, 455, 3526 [NASA ADS] [CrossRef] [Google Scholar]
- Harris, D. E., & Krawczynski, H. 2006, ARA&A, 44, 463 [NASA ADS] [CrossRef] [Google Scholar]
- Harris, D. E., Finoguenov, A., Bridle, A. H., Hardcastle, M. J., & Laing, R. A. 2002, ApJ, 580, 110 [Google Scholar]
- Harris, D. E., Mossman, A. E., & Walker, R. C. 2004, ApJ, 615, 161 [Google Scholar]
- He, J.-C., Sun, X.-N., Wang, J.-S., et al. 2023, MNRAS, 525, 5298 [Google Scholar]
- Heesen, V., Croston, J. H., Harwood, J. J., Hardcastle, M. J., & Horellou, C. 2017, MNRAS, 467, L1 [NASA ADS] [CrossRef] [Google Scholar]
- Hillas, A. M. 1984, ARA&A, 22, 425 [Google Scholar]
- Iguchi, S., Okuda, T., & Sudou, H. 2010, ApJ, 724, L166 [NASA ADS] [CrossRef] [Google Scholar]
- Kataoka, J., Leahy, J. P., Edwards, P. G., et al. 2003, A&A, 410, 833 [NASA ADS] [CrossRef] [EDP Sciences] [Google Scholar]
- Kataoka, J., Stawarz, Ł., Harris, D. E., et al. 2008, ApJ, 685, 839 [Google Scholar]
- Laing, R. A., & Bridle, A. H. 2002, MNRAS, 336, 1161 [NASA ADS] [CrossRef] [Google Scholar]
- Laing, R. A., & Bridle, A. H. 2008, ASP Conf. Ser., 386, 70 [Google Scholar]
- Laing, R. A., & Bridle, A. H. 2013, MNRAS, 432, 1114 [NASA ADS] [CrossRef] [Google Scholar]
- Laing, R. A., Canvin, J. R., & Bridle, A. H. 2003, New Astron. Rev., 47, 577 [Google Scholar]
- Laing, R. A., Canvin, J. R., Bridle, A. H., & Hardcastle, M. J. 2006a, MNRAS, 372, 510 [Google Scholar]
- Laing, R. A., Canvin, J. R., Cotton, W. D., & Bridle, A. H. 2006b, MNRAS, 368, 48 [NASA ADS] [Google Scholar]
- Lemoine, M. 2019, Phys. Rev. D, 99, 083006 [Google Scholar]
- Liu, R.-Y., Rieger, F. M., & Aharonian, F. A. 2017, ApJ, 842, 39 [NASA ADS] [CrossRef] [Google Scholar]
- Marshall, H. L., Miller, B. P., Davis, D. S., et al. 2002, ApJ, 564, 683 [Google Scholar]
- Meyer, E. T., Sparks, W. B., Biretta, J. A., et al. 2013, ApJ, 774, L21 [NASA ADS] [CrossRef] [Google Scholar]
- Meyer, E. T., Georganopoulos, M., Sparks, W. B., et al. 2015, ApJ, 805, 154 [NASA ADS] [CrossRef] [Google Scholar]
- Meyer, E. T., Breiding, P., Georganopoulos, M., et al. 2017, ApJ, 835, L35 [Google Scholar]
- Meyer, E. T., Petropoulou, M., Georganopoulos, M., et al. 2018, ApJ, 860, 9 [Google Scholar]
- Perlman, E. S., & Wilson, A. S. 2005, ApJ, 627, 140 [NASA ADS] [CrossRef] [Google Scholar]
- Perlman, E. S., Biretta, J. A., Sparks, W. B., Macchetto, F. D., & Leahy, J. P. 2001, ApJ, 551, 206 [Google Scholar]
- Perlman, E. S., Padgett, C. A., Georganopoulos, M., et al. 2009, ApJ, 708, 171 [Google Scholar]
- Piner, B. G., Jones, D. L., & Wehrle, A. E. 2001, AJ, 122, 2954 [NASA ADS] [CrossRef] [Google Scholar]
- Rieger, F. M. 2019, Galaxies, 7, 78 [NASA ADS] [CrossRef] [Google Scholar]
- Rieger, F. M., & Duffy, P. 2004, ApJ, 617, 155 [NASA ADS] [CrossRef] [Google Scholar]
- Rieger, F. M., & Duffy, P. 2019, ApJ, 886, L26 [Google Scholar]
- Rieger, F. M., & Duffy, P. 2021, ApJ, 907, L2 [Google Scholar]
- Rieger, F. M., & Duffy, P. 2022, ApJ, 933, 149 [Google Scholar]
- Rieger, F. M., & Duffy, P. 2025, ApJ, 988, 245 [Google Scholar]
- Rieger, F. M., & Mannheim, K. 2002, A&A, 396, 833 [NASA ADS] [CrossRef] [EDP Sciences] [Google Scholar]
- Rieger, F. M., Bosch-Ramon, V., & Duffy, P. 2007, Ap&SS, 309, 119 [NASA ADS] [CrossRef] [Google Scholar]
- Sudou, H., Iguchi, S., Murata, Y., & Taniguchi, Y. 2003, Science, 300, 1263 [NASA ADS] [CrossRef] [Google Scholar]
- Sun, X.-N., Yang, R.-Z., Rieger, F. M., Liu, R.-Y., & Aharonian, F. 2018, A&A, 612, A106 [NASA ADS] [CrossRef] [EDP Sciences] [Google Scholar]
- Tavecchio, F. 2021, MNRAS, 501, 6199 [Google Scholar]
- Tavecchio, F., & Ghisellini, G. 2009, MNRAS, 394, L131 [Google Scholar]
- Tavecchio, F., Maraschi, L., Sambruna, R. M., & Urry, C. M. 2000, ApJ, 544, L23 [Google Scholar]
- Walsh, J. L., Barth, A. J., & Sarzi, M. 2010, ApJ, 721, 762 [NASA ADS] [CrossRef] [Google Scholar]
- Wan, S.-Y., Wang, J.-S., & Liu, R.-Y. 2026, ApJ, 997, 128 [Google Scholar]
- Wang, J.-S., Reville, B., Liu, R.-Y., Rieger, F. M., & Aharonian, F. A. 2021, MNRAS, 505, 1334 [Google Scholar]
- Wang, J.-S., Reville, B., Mizuno, Y., Rieger, F. M., & Aharonian, F. A. 2023, MNRAS, 519, 1872 [Google Scholar]
- Wang, J.-S., Reville, B., Rieger, F. M., & Aharonian, F. A. 2024, ApJ, 977, L20 [Google Scholar]
- Waters, C. Z., & Zepf, S. E. 2005, ApJ, 624, 656 [Google Scholar]
- Webb, G. M. 1985, ApJ, 296, 319 [Google Scholar]
- Webb, G. M. 1989, ApJ, 340, 1112 [Google Scholar]
- Webb, G. M., Jokipii, J. R., & Morfill, G. E. 1994, ApJ, 424, 158 [Google Scholar]
- Webb, G. M., Barghouty, A. F., Hu, Q., & le Roux, J. A. 2018, ApJ, 855, 31 [Google Scholar]
- Webb, G. M., Al-Nussirat, S., Mostafavi, P., et al. 2019, ApJ, 881, 123 [Google Scholar]
- Webb, G. M., Mostafavi, P., Al-Nussirat, S., et al. 2020, ApJ, 894, 95 [Google Scholar]
- Webb, G. M., Xu, Y., Biermann, P. L., et al. 2023, ApJ, 958, 169 [Google Scholar]
- Weisskopf, M. C., Brinkman, B., Canizares, C., et al. 2002, PASP, 114, 1 [NASA ADS] [CrossRef] [Google Scholar]
- Wilson, A. S., & Yang, Y. 2002, ApJ, 568, 133 [Google Scholar]
- Worrall, D. M., & Birkinshaw, M. 2005, MNRAS, 360, 926 [NASA ADS] [CrossRef] [Google Scholar]
- Worrall, D. M., Birkinshaw, M., O’Sullivan, E., et al. 2010, MNRAS, 408, 701 [Google Scholar]
- Wu, Q., Cao, X., & Wang, D.-X. 2011, ApJ, 735, 50 [Google Scholar]
- Zabalza, V. 2015, in 34th International Cosmic Ray Conference (ICRC2015), 34, 922 [Google Scholar]
- Zhang, J., Du, S.-S., Guo, S.-C., et al. 2018, ApJ, 858, 27 [Google Scholar]
Appendix A: Additional tables
Chandra observations of the reanalyzed FR I sources.
X-ray positions and sizes of the knots.
Derived parameters from our SED fits.
Derived parameters of the jet dynamics.
All Tables
All Figures
|
Fig. 1. Best-fit SEDs of the X-ray knots in M 87. All data points are taken from the references, see details in Section 2. The dotted lines and dashed lines represent the radiation produced by the low-energy and high-energy electron populations, respectively. The cyan and yellow lines denote synchrotron and IC-CMB radiation, respectively. The dashed blue lines represent the IC contribution from the second electron population scattering off the synchrotron photon field of the first electron population. The solid black lines indicate the total nonthermal emission. In the γ-ray band, measurements from different instruments are denoted by different colors. In the last panel, the solid lines of different colors represent the total IC emission contributions from the different knots, and the black line represents the sum of the emission from all modeled knots. |
| In the text | |
|
Fig. 2. Best-fit SEDs of X-ray-bright jet regions in M 84, 3C 15, 3C 346, 3C 264, 3C 296, and 3C 31. Red data points are from reanalyzed Chandra and Fermi data. In the γ-ray band, points of other colors represent data from instruments other than Fermi-LAT. Data points (except the red ones) are from the references, see details in Section 2. The styles of lines are the same as in Figure 1. |
| In the text | |
|
Fig. 3. Fitting results and broadband SEDs of the X-ray-bright jet regions in 3C 66B and NGC 4263. The styles of data and lines are the same as in Figure 2. |
| In the text | |
|
Fig. 4. Comparison of the fitted jet parameters for the FR I (blue solid histograms) and FR II (dashed red histograms) samples. The panels show, respectively, (top left) the shear accelerated electron spectral index α, (top middle) the dimensionless shear viscosity parameter w, (top right) the spine velocity β0, l, (bottom left) the magnetic field strength B, and (bottom right) the maximum electron energy Ee, max. |
| In the text | |
Current usage metrics show cumulative count of Article Views (full-text article views including HTML views, PDF and ePub downloads, according to the available data) and Abstracts Views on Vision4Press platform.
Data correspond to usage on the plateform after 2015. The current usage metrics is available 48-96 hours after online publication and is updated daily on week days.
Initial download of the metrics may take a while.