Fig. 1.
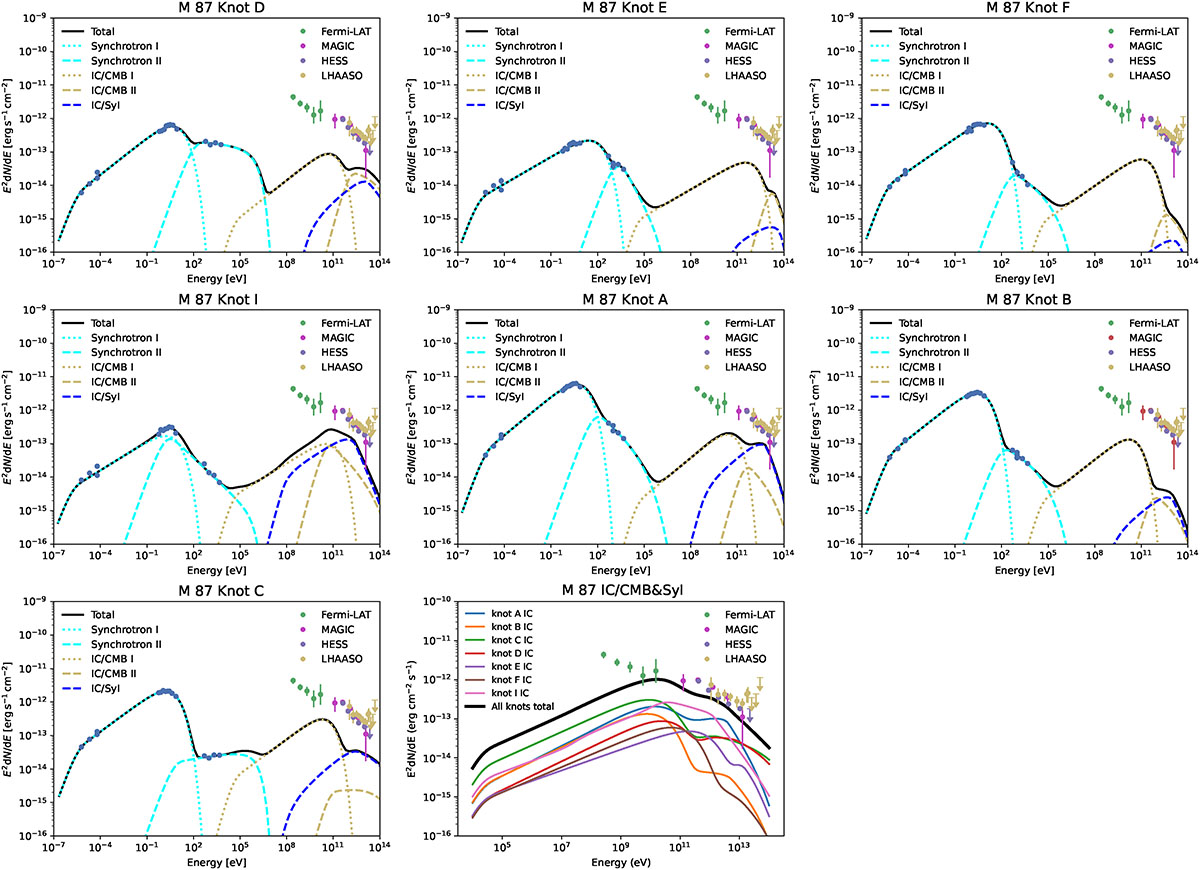
Download original image
Best-fit SEDs of the X-ray knots in M 87. All data points are taken from the references, see details in Section 2. The dotted lines and dashed lines represent the radiation produced by the low-energy and high-energy electron populations, respectively. The cyan and yellow lines denote synchrotron and IC-CMB radiation, respectively. The dashed blue lines represent the IC contribution from the second electron population scattering off the synchrotron photon field of the first electron population. The solid black lines indicate the total nonthermal emission. In the γ-ray band, measurements from different instruments are denoted by different colors. In the last panel, the solid lines of different colors represent the total IC emission contributions from the different knots, and the black line represents the sum of the emission from all modeled knots.
Current usage metrics show cumulative count of Article Views (full-text article views including HTML views, PDF and ePub downloads, according to the available data) and Abstracts Views on Vision4Press platform.
Data correspond to usage on the plateform after 2015. The current usage metrics is available 48-96 hours after online publication and is updated daily on week days.
Initial download of the metrics may take a while.