Fig. 2.
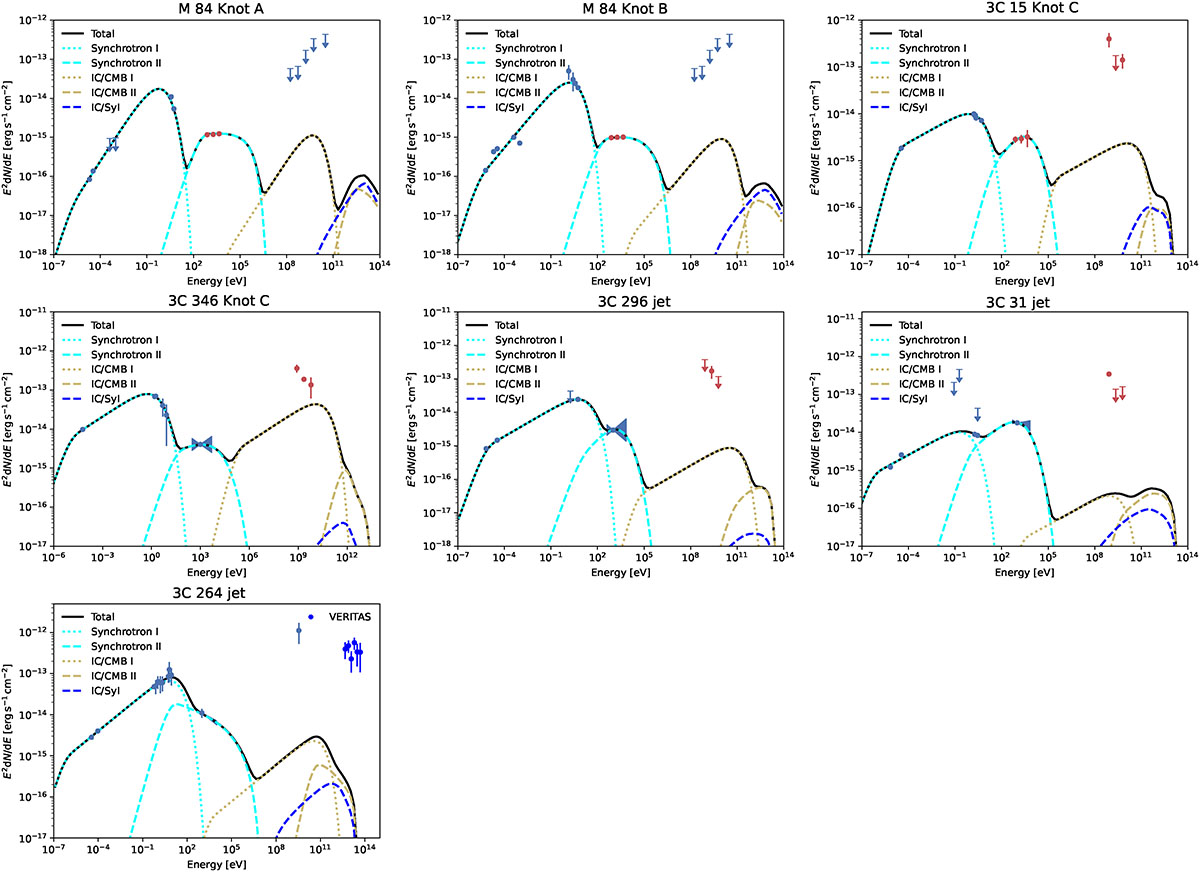
Download original image
Best-fit SEDs of X-ray-bright jet regions in M 84, 3C 15, 3C 346, 3C 264, 3C 296, and 3C 31. Red data points are from reanalyzed Chandra and Fermi data. In the γ-ray band, points of other colors represent data from instruments other than Fermi-LAT. Data points (except the red ones) are from the references, see details in Section 2. The styles of lines are the same as in Figure 1.
Current usage metrics show cumulative count of Article Views (full-text article views including HTML views, PDF and ePub downloads, according to the available data) and Abstracts Views on Vision4Press platform.
Data correspond to usage on the plateform after 2015. The current usage metrics is available 48-96 hours after online publication and is updated daily on week days.
Initial download of the metrics may take a while.