Fig. 4
Download original image
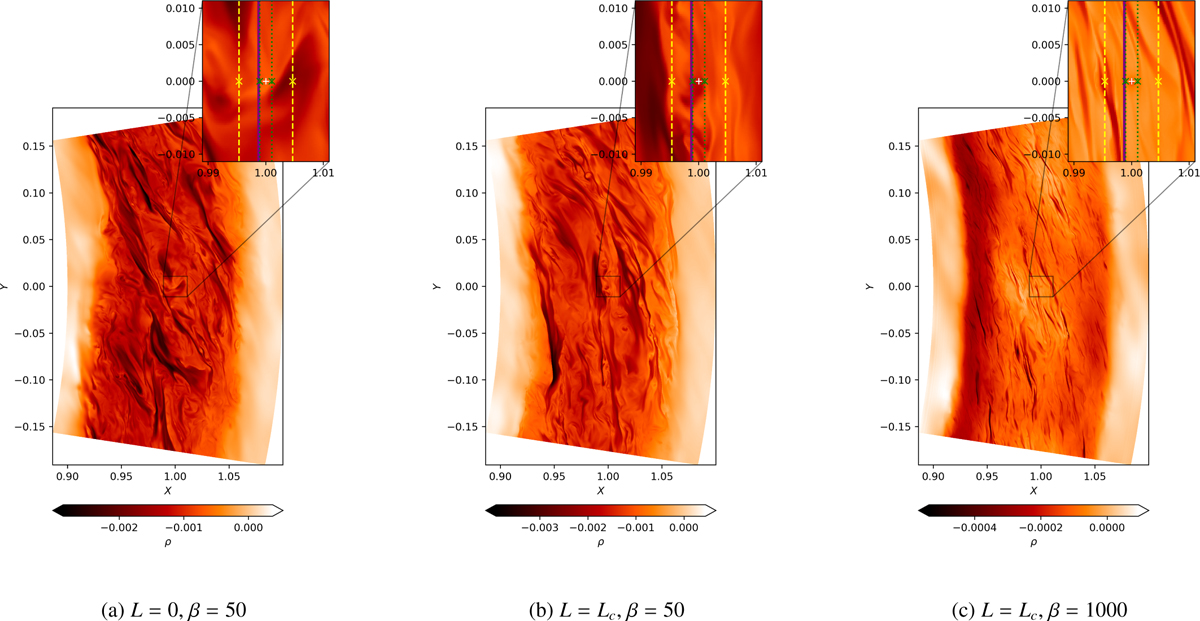
Gas density (logarithmic scale) at the midplane at t = 11 orbits. The zoomed regions correspond to an area similar to that shown in Fig. around the planetary embryo. In these regions, no low-density structures resembling hot lobes were observed. The solid purple lines indicate the corotation radii. The dashed yellow and dotted green lines mark the locations of the magnetic resonances for ß = 50 and ß = 1000, respectively. The white plus symbol denotes the position of the planetary embryo.
Current usage metrics show cumulative count of Article Views (full-text article views including HTML views, PDF and ePub downloads, according to the available data) and Abstracts Views on Vision4Press platform.
Data correspond to usage on the plateform after 2015. The current usage metrics is available 48-96 hours after online publication and is updated daily on week days.
Initial download of the metrics may take a while.