Fig. B.1
Download original image
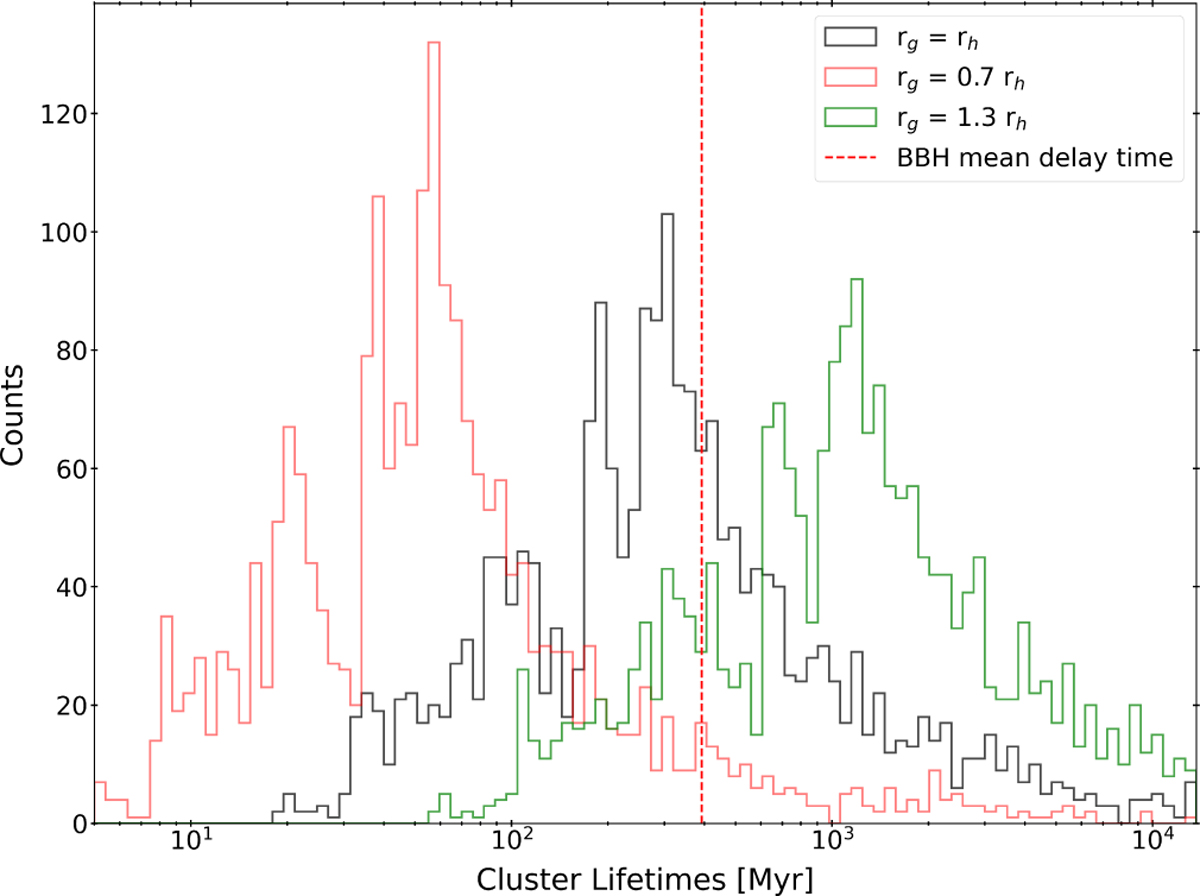
Distributions of GC lifetimes as a function of their orbital distance from the galactic center. Black line represents our fiducial model (rg = rh), while red and green histograms indicate deeper orbits (rg = 0.7 rh) and more peripheral orbits (rg = 1.3 rh), respectively. Vertical dashed red line indicates the BBH mean delay time.
Current usage metrics show cumulative count of Article Views (full-text article views including HTML views, PDF and ePub downloads, according to the available data) and Abstracts Views on Vision4Press platform.
Data correspond to usage on the plateform after 2015. The current usage metrics is available 48-96 hours after online publication and is updated daily on week days.
Initial download of the metrics may take a while.