Fig. 2
Download original image
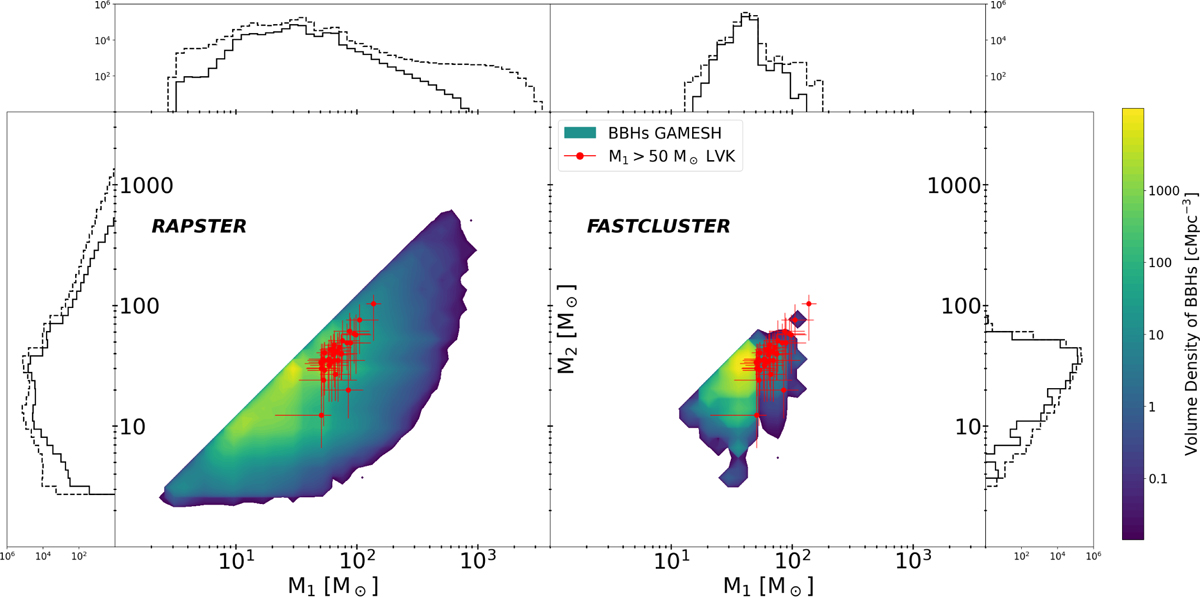
Primary (M1) and secondary (M2) BH mass distribution of observable dynamically formed BBHs within our LG-like volume. Red dots show the estimated median values of the most massive GW events (M1 > 50 M0) detected by the LVK collaboration up to O4a, with error bars representing the 90% credible intervals. Dashed lines in histograms display the mass distributions of all BBH mergers that occur in our simulation.
Current usage metrics show cumulative count of Article Views (full-text article views including HTML views, PDF and ePub downloads, according to the available data) and Abstracts Views on Vision4Press platform.
Data correspond to usage on the plateform after 2015. The current usage metrics is available 48-96 hours after online publication and is updated daily on week days.
Initial download of the metrics may take a while.