Fig. 1
Download original image
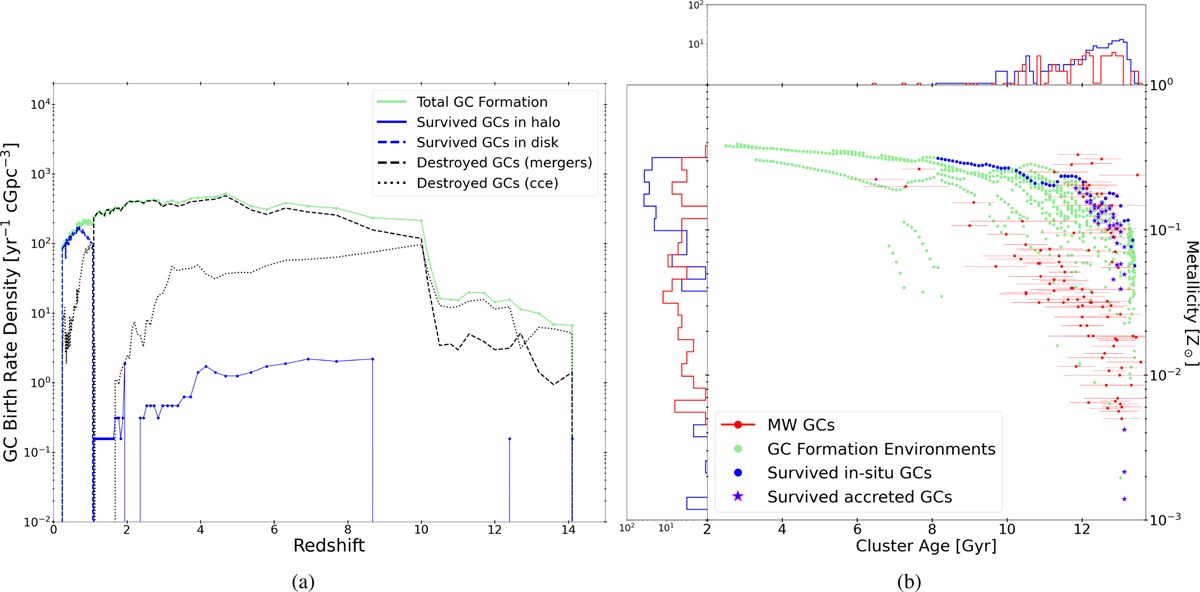
(a) Global birth rate density of GCs in the GAMESH simulation as a function of redshift (solid green line). Black lines represent GCs that will not reach z=0 due to either galaxy mergers (dashed line) or gas interactions (dotted line), whereas blue lines show GCs that survive either in the MW halo (solid) or in the disk (dashed) until today. (b) Age-metallicity distribution of surviving MW GCs formed in situ in the MW galaxy main progenitors (blue dots) and accreted through galaxy mergers (blue stars). Red dots with error bars correspond to individual GCs observed in our Galaxy (Kruijssen 2015). Conversely, green dots represent all GC formation environments within our LG-like volume.
Current usage metrics show cumulative count of Article Views (full-text article views including HTML views, PDF and ePub downloads, according to the available data) and Abstracts Views on Vision4Press platform.
Data correspond to usage on the plateform after 2015. The current usage metrics is available 48-96 hours after online publication and is updated daily on week days.
Initial download of the metrics may take a while.