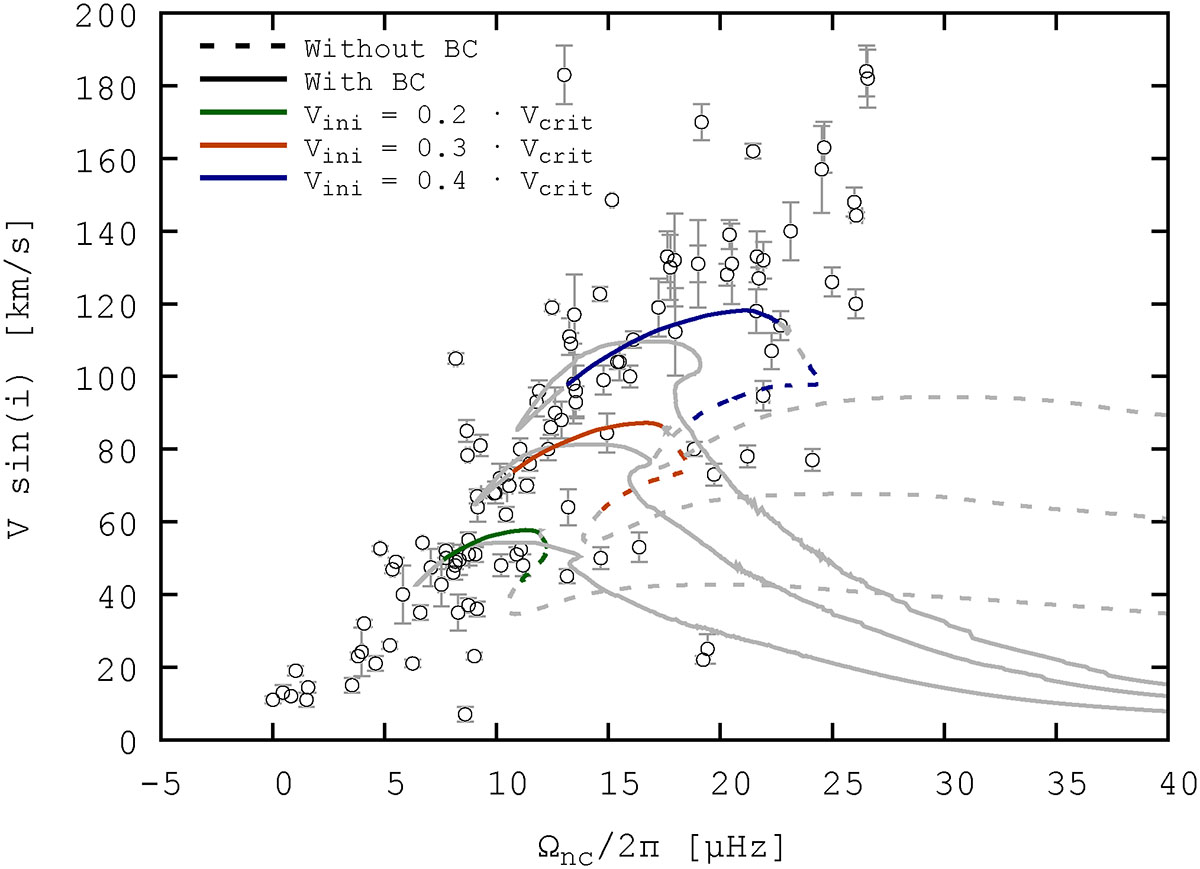
Fig. 2.
Download original image
Projected surface rotation velocity, Vsin(i), as a function of the near-core rotation velocity, Ωnc. The lines represent our simulations. The line types and colours have the same meanings as in Fig. 1, with the addition of a simulation where the initial rotation velocity is Vini = 0.3 ⋅ Vcrit (red). Colours are used only for the evolutionary stages in which the buoyancy radius remains within the range P0 = 4092 ± 575 s, which is consistent with the plotted observational data from Li et al. (2020). The surface velocities of our models have been multiplied by π/4 in order to take the unknown distribution of the inclination into consideration.
Current usage metrics show cumulative count of Article Views (full-text article views including HTML views, PDF and ePub downloads, according to the available data) and Abstracts Views on Vision4Press platform.
Data correspond to usage on the plateform after 2015. The current usage metrics is available 48-96 hours after online publication and is updated daily on week days.
Initial download of the metrics may take a while.