Fig. 5
Download original image
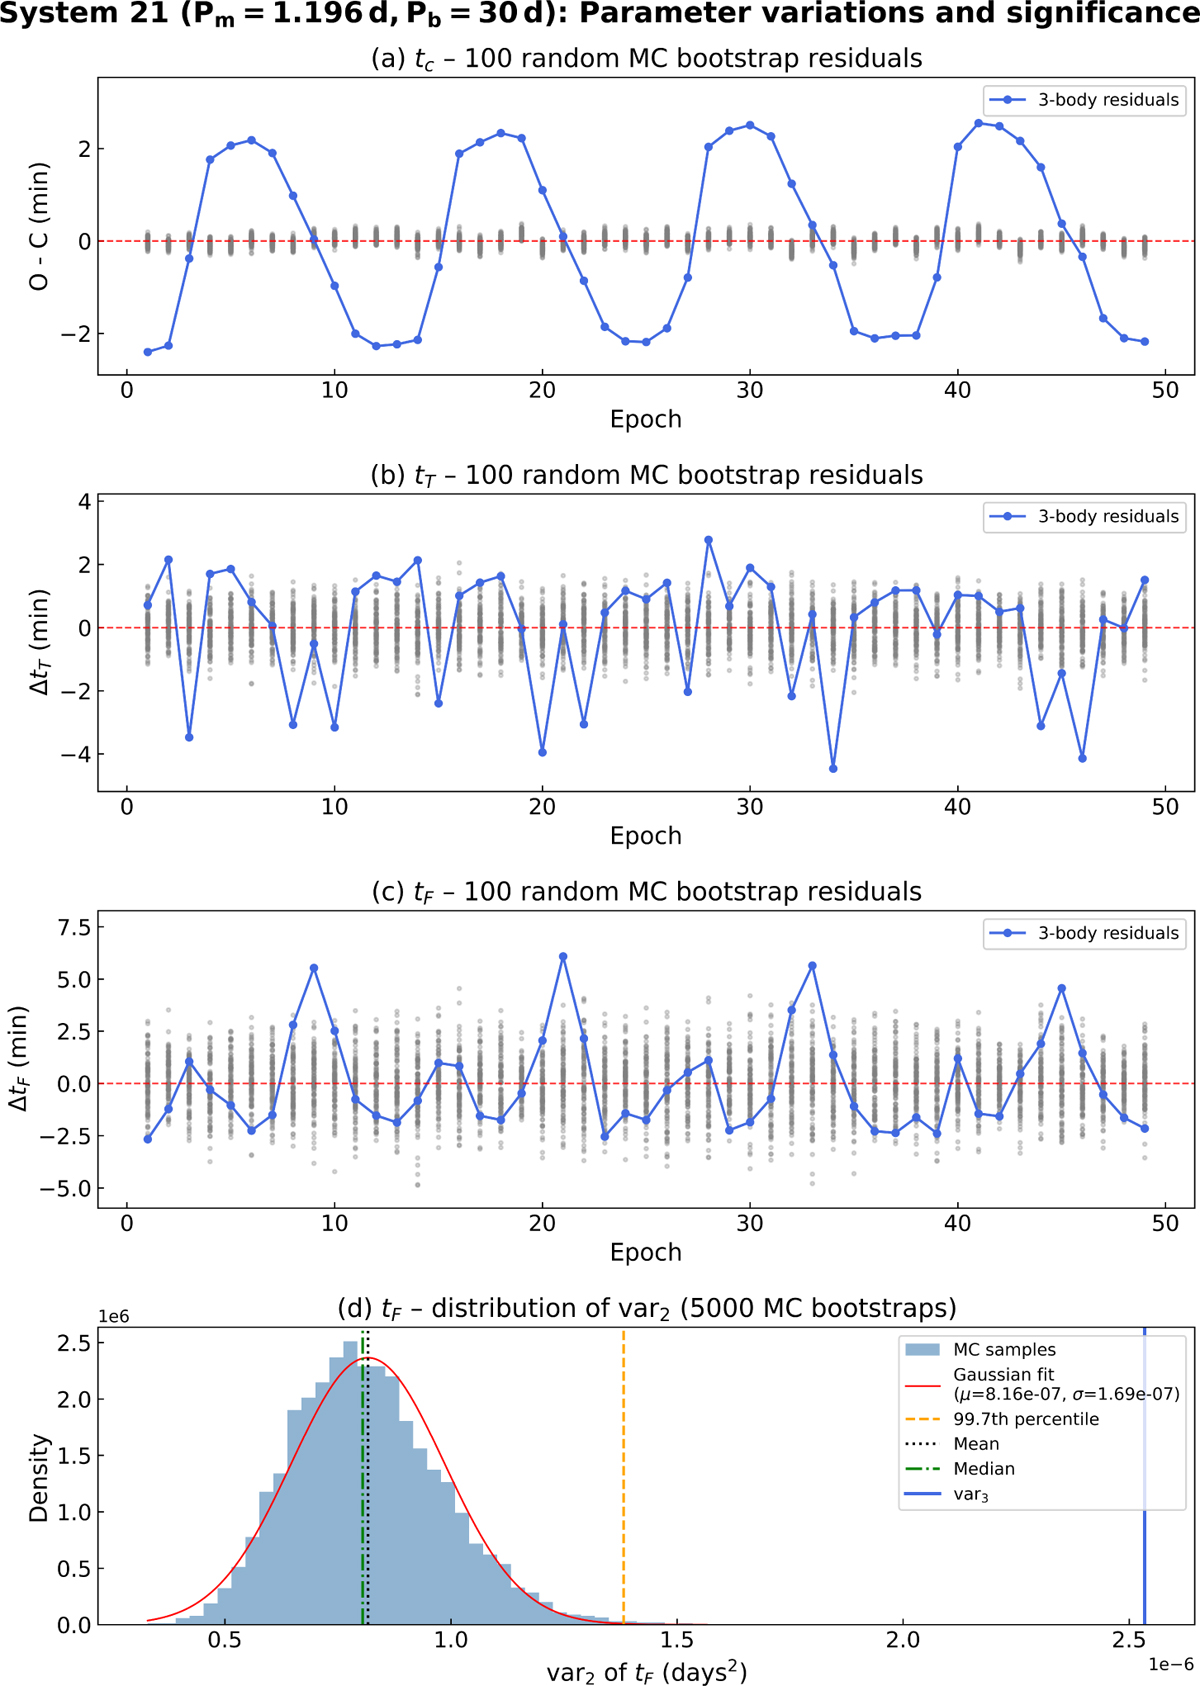
Extracted parameter variation series and MCB detection analysis for system simu 21 (Pm = 1.196 d, Pb = 30 d) over a four-year baseline (49 epochs), (a–c) Residual series for the mid-transit time (tc,TTV), total transit duration (tT, TDV), and flat-bottom duration (tF, TFV). The vertical axes display the deviations in minutes (for tc and tT) or the residual value (for tF). Blue dots connected by solid lines represent the T×Vs from the three-body simulation, exhibiting clear periodic modulations induced by the presence of exomoon. Gray dots represent 100 random T×V series generated from the two-body MCB resamples. The red dashed line denotes zero variation, (d) Histogram of 5000 var2 values (variance of the two-body residuals for tF) with a Gaussian fit (red curve). The vertical solid blue line indicates the observed variance (var3) from the three-body simulation, which lies far beyond the 99.7th percentile threshold (orange dashed line), confirming a robust detection. Black dotted and green dash-dotted lines denote the mean and median of the distribution, respectively.
Current usage metrics show cumulative count of Article Views (full-text article views including HTML views, PDF and ePub downloads, according to the available data) and Abstracts Views on Vision4Press platform.
Data correspond to usage on the plateform after 2015. The current usage metrics is available 48-96 hours after online publication and is updated daily on week days.
Initial download of the metrics may take a while.