Fig. 4
Download original image
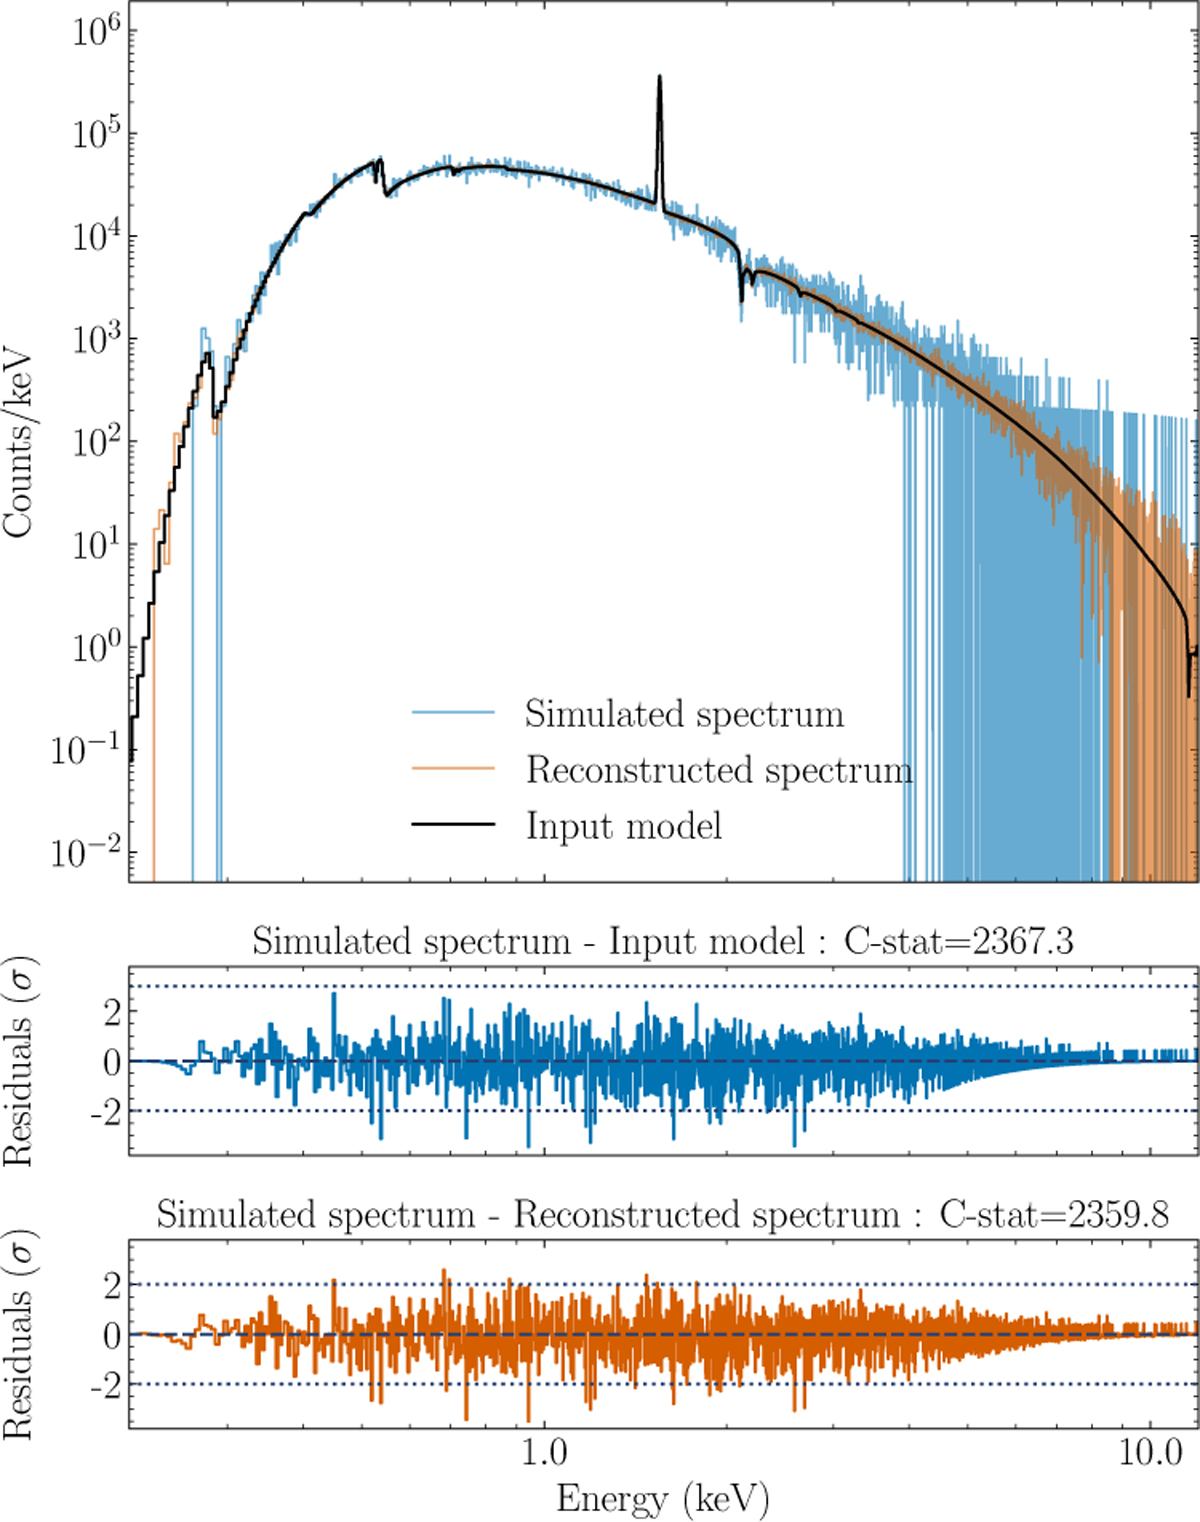
Random simulated spectrum including Poisson noise (blue), with its input model (black line). The spectrum reconstructed by the decoder part of the auto-encoder is shown in orange. The residuals, expressed in σ, between the simulated spectrum and both the input model and the reconstructed spectrum are shown in the bottom panels. The corresponding C-STAT (without minimization) is listed for indication.
Current usage metrics show cumulative count of Article Views (full-text article views including HTML views, PDF and ePub downloads, according to the available data) and Abstracts Views on Vision4Press platform.
Data correspond to usage on the plateform after 2015. The current usage metrics is available 48-96 hours after online publication and is updated daily on week days.
Initial download of the metrics may take a while.