Fig. 13
Download original image
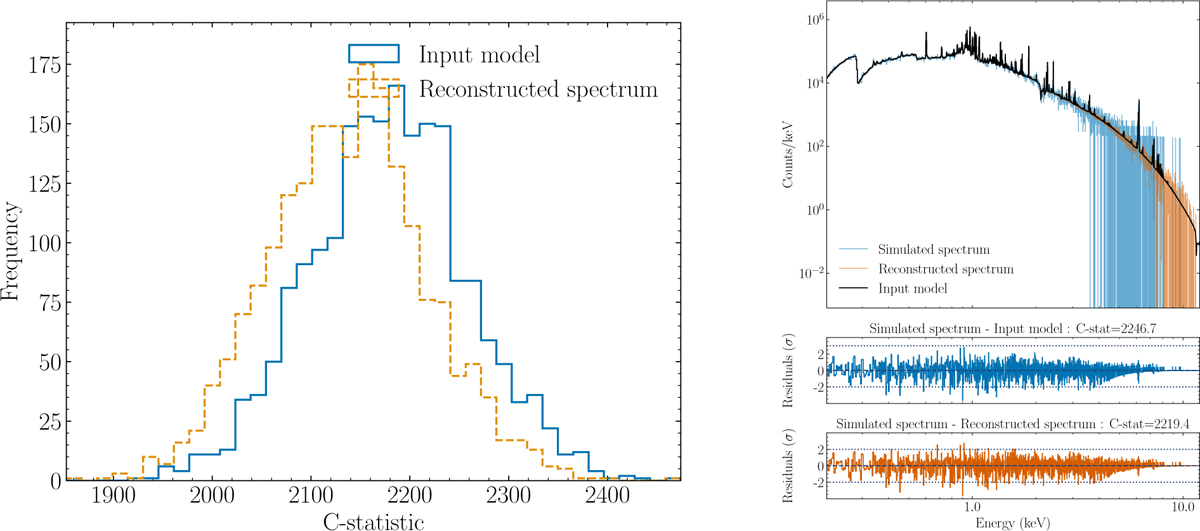
Left: histogram of C-STAT of a sample of 2000 simulated spectra, with model parameters drawn from the truncated proposal after the first round of inference. The C-STAT are computed with respect to the input model (blue solid line) and the reconstructed spectrum (dashed orange line), without any minimization. Right: random example of such a sample spectrum (blue), with its input model (black solid line) and the reconstructed spectrum, from the decoder part of the auto-encoder (in orange). The residuals, expressed in σ, between the simulated spectrum and both the input model and the reconstructed spectrum are shown in the bottom panels, with the same colors. The corresponding C-STAT (without minimization) is listed for indication at the top of each sub-panel. The observed reduction in C-STAT for the reconstructed spectra suggests that the autoencoder partially fits Poisson realization noise: the impact on the efficiency of the SIXSA pipeline warrants further investigation.
Current usage metrics show cumulative count of Article Views (full-text article views including HTML views, PDF and ePub downloads, according to the available data) and Abstracts Views on Vision4Press platform.
Data correspond to usage on the plateform after 2015. The current usage metrics is available 48-96 hours after online publication and is updated daily on week days.
Initial download of the metrics may take a while.