| Issue |
A&A
Volume 708, April 2026
|
|
|---|---|---|
| Article Number | A358 | |
| Number of page(s) | 8 | |
| Section | The Sun and the Heliosphere | |
| DOI | https://doi.org/10.1051/0004-6361/202557268 | |
| Published online | 27 April 2026 | |
Coronal mass ejection plasma diagnostics using Metis coronagraph
Deriving physical parameters of an erupting prominence from simultaneous visible-light and UV observations
1
Faculty of Education, University of Ljubljana, Kardeljeva ploščad 16, 1000 Ljubljana, Slovenia
2
Faculty of Mathematics and Physics, University of Ljubljana, Jadranska 19, 1000 Ljubljana, Slovenia
3
Astronomical Institute, The Czech Academy of Sciences, 25165 Ondřejov, Czech Republic
4
Center of Excellence – Solar and Stellar Activity, University of Wroclaw, Kopernika 11, 51622 Wroclaw, Poland
5
INAF – Osservatorio Astronomico di Capodimonte, Salita Moiariello 16, 80131 Napoli, Italy
6
INAF – Turin Astrophysical Observatory, Via Osservatorio 20, 10025 Pino Torinese, TO, Italy
7
University of Firenze, Firenze, Italy
8
INAF – Osservatorio Astrofisico di Arcetri, Firenze, Italy
9
INAF – Osservatorio Astrofisico di Catania, Via Santa Sofia 78, 95123 Catania, Italy
10
Institute of Physics, University of Graz, Universitätsplatz 5, 8010 Graz, Austria
11
INAF – Osservatorio Astronomico di Trieste, Via G.B. Tiepolo, 11, I-34143 Trieste, Italy
★ Corresponding author: This email address is being protected from spambots. You need JavaScript enabled to view it.
Received:
16
September
2025
Accepted:
16
March
2026
Abstract
Context. We investigate the physical conditions of erupting prominences embedded in coronal mass ejection (CME) cores.
Aims. The physical parameters of interest were derived by combining the hydrogen Lyman α (Lα) and visible-light (VL) images simultaneously observed by Solar Orbiter/Metis. In particular, we focus on the bright CME event that occurred on April 25-26, 2021.
Methods. Our method is based on 2D non-LTE (i.e. non-local thermodynamic equilibrium) modeling of moving structures to derive the integrated intensity of the Lα line (ELα), together with VL emission. Our method is based on a novel diagnostic tool that combines the emission measure (EM) at a given temperature derived from the observed Lα intensity with the electron column density (Ne) obtained from VL Stokes I and Q data. This approach determines the electron density (ne) and the effective thickness (Deff) inside the prominence structure. Here, we use a similar diagnostic tool to the one that we proposed for solar eclipses by combining hydrogen Balmer α (Hα) and VL data in previous studies.
Results. We analyzed 32 spatial points within the northern part of the prominence. We ran a 2D non-LTE transfer code for these points by assuming a uniform prominence temperature. The results are presented as 2D maps of the electron density and effective thickness at a given temperature. For the brightest pixel, we also estimated the temperature by assuming collisional ionization equilibrium and compared the result with our value obtained using the emission-measure method.
Conclusions. We demonstrate how ne and Deff inferences depend on the temperature of the structure. The higher the temperature, the lower the effective thickness, and the higher the electron density. This study creates foundation for future diagnostics of eruptive prominences with the Solar Orbiter/Metis coronagraph. It shows that combined UV and VL diagnostics provides a powerful tool for analyzing such events. But it also confirms that the consideration of the helium D3 line emission within the VL channel is essential to obtain accurate results.
Key words: Sun: atmosphere / Sun: coronal mass ejections (CMEs) / Sun: filaments / prominences / Sun: UV radiation
© The Authors 2026
 Open Access article, published by EDP Sciences, under the terms of the Creative Commons Attribution License (https://creativecommons.org/licenses/by/4.0), which permits unrestricted use, distribution, and reproduction in any medium, provided the original work is properly cited.
This article is published in open access under the Subscribe to Open model. This email address is being protected from spambots. You need JavaScript enabled to view it. to support open access publication.
1. Introduction
Coronal mass ejections (CMEs) are the most energetic eruptive phenomena in the Solar System and the primary drivers of severe space weather disturbances at Earth (e.g., Chen 2011; Webb & Howard 2012). Observations in visible light (VL) using coronagraphs often reveal a classic three-part structure consisting of a bright leading front, a dark cavity, and a bright core (see review by Webb & Howard 2012). This core corresponds to the erupting prominence (EP), which represents a magnetic flux rope carrying cool, chromospheric material into the heliosphere.
Characterizing the physical conditions of the plasma within these EPs, specifically their electron density, temperature, and ionization state, is crucial for understanding the thermodynamic evolution of the ejecta and the energy budget of the eruption (e.g., Gilbert et al. 2000; Akmal et al. 2001; Gopalswamy et al. 2003; Schmieder et al. 2013). However, determining the physical plasma parameters of EPs is a challenge once the structure moves away from the solar limb. While ground-based Hα observations provide important information, observations in the ultraviolet (UV), and namely the bright hydrogen Lyman α (Lα) line, are an important diagnostic for cooler plasma components within these structures, Heinzel et al. (see e.g., 2016). Historically, determining these parameters relied on combining data from different instruments, such as the spectrographs and coronagraphs on board the Solar and Heliospheric Observatory (SOHO). For instance, combining data from the UV coronagraph spectrometer (UVCS) and the Large Angle and Spectrometric Coronagraph (LASCO) allowed researchers to infer properties of the prominence plasma (e.g., Ciaravella et al. 2000; Raymond & Ciaravella 2004; Heinzel et al. 2016). Although these instruments provided invaluable spectroscopic data, their analyses are often limited by single-slit spatial coverage (Kohl et al. 2006; Susino & Bemporad 2016; Bemporad et al. 2018) and by the lack of co-spatial and co-temporal VL images, which prevented them from capturing the full complexity of the rapidly evolving 3D structure.
The launch of the Solar Orbiter in 2020 (Müller et al. 2020) offers a new vantage point for the study of EPs. The on-board Metis coronagraph (Antonucci et al. 2020) has a unique ability to study the extended solar corona in both broadband VL (580–640 nm) and narrowband UV Lα line (121.6 nm; Fineschi et al. 2020; Romoli et al. 2021). This combination of simultaneous spatial and full field-of-view (FoV) imaging represents a significant leap in diagnostic capability. The VL channel primarily observes the K corona (Thomson scattered light) and potentially bright emission lines within the channel’s passband, such as the helium D3 line from EPs, while the UV channel captures the Lα emission from the embedded cool EP material. Early Metis observations have already captured numerous events with exceptionally bright Lα emission (Russano et al. 2024) and the first detections of the helium D3 line in an EP (Heinzel et al. 2023).
In this paper, we use these unique capabilities of simultaneous VL and Lα observations to determine important physical parameters, namely the electron density (ne) and effective thickness (Deff) of a large, bright EP observed on April 25-26, 2021, as it propagated through the Metis FoV at de-projected heights of about 4.6–10.9 R⊙. We combine the measured integrated Lα intensity (ELα) from the Metis UV images with the estimated electron column density (Ne) derived by Heinzel et al. (2023) from the Metis VL Stokes I and Q data. A crucial part of this process is the careful correction for significant contamination of the VL signal by the helium D3 line emission. Finally, we compare these observational data with a large grid of 2D non-LTE (i.e., non-local thermodynamic equilibrium) models computed with the Multi-level Accelerated Lambda Iteration (MALI) code (Heinzel & Anzer 2001; Jejčič et al. 2025), which allows us to determine both ne and Deff for the observed EP. This diagnostic method, which allows us to constrain the temperature of the prominence core, builds upon techniques originally proposed for eclipse observations (e.g., Jejčič & Heinzel 2009) but is applied here for the first time to coronagraphic Metis data.
This paper is organized as follows. Section 2 describes the Metis observations and geometrical reconstruction. In Sect. 3 we present the data analyses together with the 2D non-LTE models and the diagnostic method. The results are presented in Sect. 4, focusing on the derived plasma parameters and their dependence on temperature. Finally, in Sect. 5, we discuss the implications of our results and summarize our main conclusions.
2. Metis observations
This study focuses on a large, bright EP observed by the Metis coronagraph on April 25-26, 2021. The Solar Orbiter spacecraft was at a heliocentric distance of 0.87 AU, meaning it had a unique vantage point with respect to the event. The prominence was associated with the core of a CME and was visible in the Metis FoV in the range between 5.3 and 11.2 R⊙. This event is one of several exceptionally bright Lα eruptions studied by Russano et al. (2024), who presented a detailed analysis of the kinematics from different viewing angles using coordinated observations from Metis, SOHO/LASCO, and STEREO-A. Our analysis focuses on a snapshot of temporally and spatially aligned images taken on April 26, 2021 at 01:05 UT, showing the well-developed structure of the EP. In the Metis images (see Fig. 1), the prominence appears as a large, twisted structure that is well defined and bright in both the Lα and VL channels.
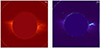 |
Fig. 1. Simultaneous Metis VL (left) and Lα (right) images of the EP on April 26, 2021, at 01:05 UT. |
The Metis instrument provides imaging in the UV channel with a narrow bandpass filter centered at 121.6 ± 10 nm to isolate the hydrogen Lα line. The VL channel observes a broad band continuum between 580 and 640 nm and is equipped with polarizers to measure the linearly polarized brightness due to Thomson scattering. For this study we use calibrated level 2 data (De Leo et al. 2023, 2025). The snapshot analyzed here was obtained by averaging 15 individual images with integration times of 60 s for the UV channel and 30 s for the VL channel, respectively, to improve the signal-to-noise ratio (S/N). Further details can be found in the papers by Heinzel et al. (2023) and Russano et al. (2024).
To properly analyze the Metis data, the interpretation of both the Lα and the VL signals depends on the viewing geometry. The polarization of the Thomson scattered light depends on the scattering angle, while the Lα intensity is affected by the Doppler dimming effect (DDE), which depends on the velocity of the plasma relative to the Sun (Withbroe et al. 1982; Noci et al. 1987). Physically, the DDE occurs because the absorption profile of the scattering atoms in the prominence is Doppler-shifted with respect to the exciting solar chromospheric Lα line profile due to the flow velocity (Vf) of the plasma. As the flow velocity increases, the amount of resonant scattering decreases, leading to a dimming of the observed intensity.
For this analysis, we used the 3D geometry derived by Russano et al. (2024) for this particular event. Using the triangulation method with SOHO/LASCO-C2 and STEREO-A/COR2 images, they tracked the central part of the “fork-like” UV prominence feature as it crossed the Metis FoV. This method yields an inclination angle of the prominence plane of 19.3° with respect to the plane of the sky (PoS) of Metis (Carrington longitude 179.5°, latitude –6°) and a de-projected flow velocity of 177 km s−1. These parameters were used to calculate the actual de-projected height of the prominence snapshot (4.6–8.3 R⊙) and served as inputs for our non-LTE models as well as for column density inferences using the VL polarimetry (Heinzel et al. 2023).
The accuracy of this velocity estimate is critical for the Lα analysis because uncertainty in velocity directly translates to uncertainty in the Doppler dimming factor. For instance, if flow velocity is underestimated (e.g., by using only the projected PoS velocity), the dimming would be underestimated, leading to an artificially high intensity and consequently an incorrect derivation of plasma parameters. In cases in which 3D reconstruction is not available, the use of projected velocities introduces a significant systematic uncertainty that must be bracketed by assuming a range of possible inclination angles.
3. Derivation of physical parameters
3.1. Corrected column density
The primary observational output from the VL channel is the electron column density, which was derived from the Thomson scattering of photospheric light by the prominence electrons. Prior to analysis, the background contribution (mainly the F–corona) was removed by subtracting the pre-event coronal image taken on April 25, 2021 at 15:00 UT from all three Stokes images (I, Q, and U; see Heinzel et al. 2023). However, the interpretation of the resulting VL signal is complicated as the Metis VL passband (580–640 nm) is contaminated by the emission of the neutral helium D3 line at 587.7 nm, which is often bright in prominences. For this particular event, Heinzel et al. (2023) found that the D3 line can contribute up to 50% of the total VL signal in the brightest pixel. Neglecting this contamination would lead to a significant overestimation of the Thomson scattering signal and consequently of the electron column density.
To isolate the pure Thomson scattering signal, we applied the method of Heinzel et al. (2023) to the Metis data. This method exploits the distinct polarization signatures of the Thomson scattering and D3 emission and allows us to separate the two signals and obtain a realistic Ne. Figure 2 shows a zoomed view of the entire prominence, with marked pixels indicating the maximum intensity identified in a series of vertical slices across the prominence structure. Points in the northern leg are highlighted in orange, while those in the southern leg are highlighted in yellow. The brightest pixel is marked in green, corresponding to the selection analyzed by Heinzel et al. (2023).
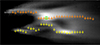 |
Fig. 2. Zoomed region of the selected brightest points in Stokes I inside the prominence. Points in the northern leg are highlighted in orange, while those in the southern leg are highlighted in yellow. The brightest pixel is marked in green, corresponding to the selection in Heinzel et al. (2023). |
We restricted our quantitative study to the northern leg of the structure, where the relatively simple geometry satisfies the assumptions required for a reliable separation of these signals. Applying the polarization analysis method of Heinzel et al. (2023) to the southern leg produced physically inconsistent results for several pixels. Specifically, the method yielded a negative helium density, resulting in an unphysical negative pure electron column density. This likely reflects systematic effects in the observational data, such as insufficient accuracy in pre-event background subtraction and/or residual instrumental bias in the Stokes measurements. To avoid introducing these systematic errors into our derived parameters, we excluded the southern points from our diagnostics and focused our detailed investigation on the subset of 32 bright pixels in the northern leg, postponing analysis of the southern leg to a future study.
For these 32 selected points inside the northern leg of the prominence, the Stokes I values are between about 0.04 and 0.16 erg s−1 cm−2 sr−1, while the polarization ratio Q/I is between 0.25 and 0.55, as shown in the top panels of Fig. 3. It is important to emphasize that these Stokes parameters in the top panels are observed values that contain both VL and D3 emission. After applying the correction, we obtained the pure electron column density for each of the 32 points. The resulting values are plotted as a function of projected distance in the PoS from the solar disk center. However, it is important to clarify that for the subsequent physical modeling and derivation of plasma parameters, we strictly used the de-projected distances derived from the 3D reconstruction described in Sect. 2.
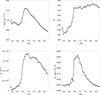 |
Fig. 3. Physical parameters of the EP as a function of projected distance from the solar disk center, calculated at 32 selected points along its northern leg. Top panels: Observational values before subtraction of the D3 contribution: Stokes I (left) and ratio Q/I (right). Bottom: Column density after subtracting the helium D3 contribution (left based on the zero-magnetic field case from Heinzel et al. 2023) and the integrated intensity emitted in the Lα line (right). |
3.2. Integrated Lα intensity
The Metis UV channel enables the estimation of the integrated Lα intensity. This was measured directly from the calibrated level 2 data. The background signal, which consists of a combination of instrumental offsets, scattered light and weak emission from the surrounding corona, was characterized in a region adjacent to the prominence and subtracted to isolate the net emission from the EP structure itself. Following the approach of Russano et al. (2024), we subtracted the background using pixels immediately adjacent to the feature within each individual frame. We adopted this local subtraction method, rather than using a fixed pre-event coronal background, to account for the instrumental behavior of the Metis UV detector. As documented by Russano et al. (2024, see Appendix A), the detector can exhibit nonlinear temporal and spatial response instabilities. Consequently, a static pre-event background subtraction would fail to correct for these short-term instrumental fluctuations. Specifically, a local background model was derived for each UV frame by defining a 70 × 70 pixel area around the target feature. We characterized the background radiance through a surface fitting procedure by selecting only the pixels external to the visible structure. Subsequent subtraction of this surface from the original sub-frame yielded a background-corrected view of the structure’s intensity distribution.
Despite the inherently low S/N of such faint structures at high altitude, the 15 images averaged by the onboard software provide a robust measurement of the Lα radiation in the prominence. Uncertainties in the measured intensity were estimated based on the photon statistics and the readout noise of the detector, following the standard Metis calibration pipeline (Romoli et al. 2021). Additionally, we considered the systematic uncertainty in the radiometric calibration of the UV channel, which is estimated to be approximately 10% (De Leo et al. 2025). Regarding the signal quality, for the 32 selected bright points, the S/N varies depending on the position within the prominence structure. The central, brightest part of the leg exhibits a high signal quality, with the S/N reaching up to 10.5. However, we note that approximately 25% of the selected points, primarily located at the fainter edges of the structure, exhibit S/N < 1. Therefore, while the core measurements are robust, these specific low-S/N data points are interpreted with caution. The distance-dependent ELα was calculated for all 32 selected points in the northern leg of the prominence, as shown in the bottom right panel of Fig. 3, with a range between 0.005 and 0.03 erg s−1 cm−2 sr−1.
3.3. 2D non-LTE models
To interpret the Metis observations, we compared the derived observational quantities with a comprehensive grid of theoretical models computed with the Multi-level Accelerated Lambda Iteration (MALI) 2D non-LTE radiative transfer code (Heinzel & Anzer 2001). The full details of this model grid, developed specifically to support Metis data analysis, are presented in Jejčič et al. (2025). The models are based on a 2D slab geometry that simulates an EP flux rope parallel to the solar surface irradiated by the incident solar disk radiation field. The code solves the radiative transfer and statistical equilibrium equations for a hydrogen atom model with five levels and continuum.
While the full grid of Jejčič et al. (2025) explores a range of physical conditions, for the specific analysis of the April 25-26, 2021 event, we fixed some parameters based on the observations. We used the de-projected height to model the prominence emission because it represents the real prominence height above the solar surface which determines the incident solar radiation. Using the projected height, which is smaller, would cause an overestimate of the incident radiation (although for this particular event the difference is small taking into account the projection angle of 19.3°). We used a single average de-projected height of 6.7 R⊙ for the models, given that the prominence height ranges from 4.6 to 8.3 R⊙, because otherwise we would need to construct our extensive grid of models (i.e., the plots in Fig. 4) for each individual pixel height. This would be computationally very expensive for 2D non-LTE modeling. Moreover, the prominence is brightest in its middle part, so the most reliable data correspond to heights near this average value. Furthermore, the variations in the geometrical dilution factor over this height range are on the order of the radiometric calibration accuracy of the Lα channel. However, in a future paper, we aim to develop a more sophisticated inversion technique based on the Levenberg-Marquardt method to fully account for these height variations. The de-projected flow velocity was set to 177 km s−1 (Sect. 2) and was calculated at the same average de-projected height of 6.7 R⊙ used for the non-LTE modeling, ensuring consistency in our evaluation of the DDE. Microturbulent velocity (Vt) was set to 10 km s−1. With these parameters fixed, our analysis examines the dependence of the model grid on the remaining free parameters: kinetic temperature (T), gas pressure (p), and effective thickness. All input parameter values are listed in Table 1. We chose a very low range of pressures for the structure so that the observed ELα lie within the range of calculated models. In total, we obtained 140 models. The output parameters are the integrated Lα intensity and the line optical thickness, the electron density, hydrogen-level populations, and radiative and collisional rates.
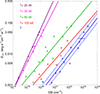 |
Fig. 4. Theoretical integrated intensity emitted in Lα line versus emission measure (EM = ne2Deff) for the range of observed Lα intensities for selected temperatures, marked by colors. The solid lines are linear least-square fits to model data. For a given observed ELα at a temperature of 150 kK, the dashed lines indicate the uncertainty range in EM determination. The horizontal blue line shows the resulting uncertainty in the derived EM at the brightest point. |
Parameters used for the model calculations.
The sensitivity of the primary observable,ELα, to these various input parameters (especially flow velocity and height) is demonstrated in Jejčič et al. (2025). However, we explicitly tested the sensitivity of the model output ELα to variations in the input kinematic parameters using test calculations at 150 kK. The Lα scattering is governed by the DDE and the geometric dilution of the incident radiation. Our tests indicate that the intensity is extremely sensitive to the flow velocity. Varying the flow velocity by 15% around its nominal value causes the resulting theoretical Lα intensity to change by about 40%. Regarding height, varying the model slab location by ±1 R⊙ from our average value 6.7 R⊙ results in Lα intensity variations of approximately 20%. As was explained above, the use of a fixed average height simplifies the calculation, and we treated these height-dependent intensity variations as a systematic uncertainty in our approach.
Finally, it is important to emphasize that all models consistently account for the solar illumination corresponding to the specific date of the Metis observation (see Gunár et al. 2020). Furthermore, the predicted ELα explicitly include the reduction due to DDE caused by the flow velocity of 177 km s−1, which is essential for the analysis of such fast-moving structures.
3.4. The diagnostic method
Our diagnostic approach extends the diagnostic tool proposed by Jejčič & Heinzel (2009), which was originally developed for the combination of Hα and VL eclipse data. In this work, we applied this technique for the first time to exploit the unique capabilities of the Metis coronagraph, specifically the simultaneous FoV images in the Lα and VL channels. This enables 2D mapping of the prominence plasma, a capability not offered by previous instruments. This approach is different from previous diagnostics of EPs, which relied on slit-based spectroscopy. For example, when analyzing the SOHO/UVCS data (Heinzel et al. 2016), line profile measurements could be used to directly constrain the effective temperature of the observed plasma. Since Metis is not a spectrograph, we cannot determine the kinetic temperature of the prominence from thermally broadened line profiles. Therefore, we must assume a uniform kinetic temperature within the structure. Our analysis thus explores a range of physically plausible uniform temperatures to understand how this unknown parameter affects the derived results.
The underlying logic of the method is to combine two independent observational quantities (Ne and ELα) to determine the two unknown plasma parameters, ne and Deff. The fundamental physical basis relies on the behavior of the Lα emission in the physical regime of eruptive prominences. The MALI models show that for a given kinetic temperature, the theoretical integrated Lα intensity is a direct function of the emission measure (EM) of the plasma, which is defined as EM = ne2Deff. This relationship, shown in Fig. 4, allows us to convert the observed Lα emission into a corresponding emission measure for a chosen temperature. We quantified the uncertainty of this conversion using the model fit at 150 kK, based on the scatter of the model points around the linear fit (solid blue line in Fig. 4). By defining an envelope that encloses this scatter, indicated by the dashed blue lines, we estimate that the relative uncertainty in deriving the EM from the observed intensity is approximately 40% across the observed range. In parallel, the pure VL signal provides a direct measurement of the electron column density, defined as Ne = neDeff.
By combining the measured ELα and Ne from the observations (Fig. 3), we solved the set of two equations to derive values for ne and Deff. For a range of assumed temperatures, we used the grid of models to find the EM corresponding to the observed ELα. The system can then be solved for each temperature:
 (1)
(1)
With this emission-measure method, we can therefore estimate ne and Deff as a function of the assumed kinetic temperature and thus constrain the physical state of the plasma over the entire observed structure. It is important to clarify that while we assumed a uniform kinetic temperature for the entire structure in a given model run, the gas pressure was not fixed. Instead, it was treated as a free parameter that varies for each of the 32 selected pixels. Regarding the robustness of this inversion, we refer to Sect. 3.2, in which we demonstrated that the majority of the selected points have a sufficient S/N (ranging up to 10.5) to constrain the model.
4. Results
Applying the diagnostic method described in Sect. 3.4, we derived the electron density and effective thickness of the studied prominence. We selected five typical kinetic temperatures (Heinzel et al. 2016): 20, 30, 60, 100, and 150 kK, assuming them to represent the uniform temperature of the whole prominence plasma structure. An important finding is that the assumption of low kinetic temperatures around 30 kK (a range where the helium D3 emission is expected to be significant; see, e.g., Heinzel et al. 2020, 2023) leads to physically unrealistic solutions. For example, the derived effective thickness at a temperature of 30 kK ranges between 5 and 230 R⊙, which is orders of magnitude larger than the observed size of the entire CME. This result strongly suggests that the EP plasma must be hotter than typical quiescent prominences to maintain a realistic geometry.
In Fig. 5 we show the derived ne and Deff as a function of distance for plausible high temperatures of 60, 100, and 150 kK, together with the physically unrealistic low-temperature solutions for comparison (20 and 30 kK). The top panel shows that the electron density generally decreases with distance for all temperature assumptions, consistent with an expanding plasma structure as it propagates outward. Assuming 150 kK, the densities derived are systematically higher than those for lower temperatures, but temperatures ≥60 kK are within a physically plausible range for a CME core. The bottom panel of Fig. 5 shows the corresponding effective thickness. At all temperatures, Deff increases with distance for most points, which is physically intuitive as one would expect the prominence material to expand as it spreads outward. However, the absolute values differ considerably. The temperature of 100 kK gives an effective thickness that increases up to 1 R⊙, whereas at 150 kK, it remains below 0.6 R⊙. This is a more realistic value for the structure inside a CME and comparable to the projected width in the PoS. In contrast, the temperature of 60 kK and lower gives much larger Deff, exceeding 10 R⊙, which is physically less plausible and not detected. Such values would also imply a large asymmetry in the shape of the eruptive prominence, where the dimension along the PoS is much smaller than that along the line of sight (LoS). Therefore, a temperature on the order of 100–150 kK seems to provide a more consistent and realistic description of the EP, even though both higher-temperature assumptions represent a significant improvement over the lower temperatures. Note that such high temperatures were also obtained from UVCS Lα spectral observations (Ciaravella et al. 2003; Heinzel et al. 2016).
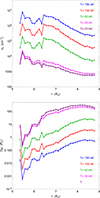 |
Fig. 5. Derived electron density (top) and effective thickness (bottom) as a function of projected distance from the solar disk center for assumed kinetic temperatures of 20, 30, 60, 100, and 150 kK, shown in different colors. |
Based on our finding that the temperatures higher than 100 kK give physically reasonable results, we produced the first 2D maps of the electron density and effective thickness at such high altitudes. The resulting distributions are shown in Fig. 6 assuming the 150 kK case, which provides the most compact and thus most likely geometric solution.
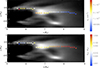 |
Fig. 6. Distribution of electron density (top) and effective thickness (bottom) inside the studied prominence structure assuming a uniform kinetic temperature of 150 kK. The points are superimposed on the Metis VL image. |
To further validate these results and independently check the most plausible temperature, we performed an analysis of the brightest pixel in the northern leg of the prominence, marked by a green circle in Fig. 2, and followed the methodology described by Susino & Bemporad (2016). Their method combines VL and Lα emission and relies on the assumption of collisional ionization equilibrium for hydrogen, which is a reasonable approximation for hot plasmas. Their method assumes optically thin Lα emission, a condition that is consistent with our detailed non-LTE calculations. Key input parameters for such a calculation include the inclination angle, de-projected flow velocity, and de-projected distance, Lα and VL brightness, and the electron density and effective thickness of the plasma in this particular pixel. For our specific calculation, it is essential to use the pure VL emission due to Thomson scattering to account for ∼50% contamination by the helium D3 line within the VL channel. As a result we obtain 170 kK. To ensure the robustness of this result, we extended the validation to ±3 points around the brightest point. These points represent the core of the northern leg, where thermodynamic conditions are expected to be relatively uniform. Indeed, in all tested locations, the independent check yields kinetic temperatures in the range of (170 ± 10) kK. This falls within the range where emission-measure method yields physically plausible solutions (Fig. 5). Therefore, considering this independent validation, we selected the temperature of 150 kK as a representative value for the EP core in this analysis because it is compatible with the Susino & Bemporad (2016) method within a discrepancy of about 10%, while also satisfying the geometric constraints of the VL and UV images.
5. Discussion and conclusions
In this work, we have presented a novel diagnostic method of determining the physical parameters of EPs and applied it to a bright event observed by the Solar Orbiter/Metis coronagraph on April 25-26, 2021. Our approach was the first to utilize the unique capabilities of Metis to combine simultaneous full FoV images in VL and UV Lα. We successfully adapted and applied a diagnostic tool using the electron column density derived from polarized VL data and the emission measure derived from Lα intensity by the non-LTE modeling. This enabled the creation of 2D maps of plasma properties within a CME core at high altitude, a significant step beyond the limitations of previous single-slit instruments. In the future, the method could be extended systematically to all prominence points to produce 2D maps of the plasma parameters.
A crucial aspect of our analysis was the treatment of the significant contamination of the VL signal by the line emission of helium D3, which accounted for up to 50% of the signal in the brightest parts of the structure. We have shown that a careful correction of this contamination is essential to obtain physically reliable results. Tests performed by ignoring this correction revealed two major physical inconsistencies. First, within our primary diagnostic, the uncorrected (higher) VL brightness leads to an overestimation of the electron column density. Second, regarding the independent validation using the Susino & Bemporad (2016) method, we found that attributing the D3 intensity to Thomson scattering results in a derived kinetic temperature higher than 300 kK.
Since the Metis coronagraph does not provide direct temperature measurements, we treated the kinetic temperature as a free parameter in our models. This approach showed a strong dependence of the derived physical parameters on the assumed temperature. Our analysis showed that assuming low temperatures, say T < 60 kK, leads to unphysically large values of effective thickness that in some cases exceed the full scale of the CME itself. Only higher temperatures, in the range of 100 kK or more, lead to geometric solutions consistent with the observed structure. This strongly suggests that the EP plasma was heated to high temperatures during its eruption, which is consistent with some previous findings for which UVCS data were exploited.
We confirmed our conclusion by independently analyzing the brightest pixel based on the assumption of collisional ionization equilibrium in hydrogen, which yielded a temperature of 170 kK. This result is a strong validation of our emission-measure method and confirms that the plasma is indeed hot. On this basis, we adopted a representative temperature of 150 kK to produce the first 2D maps of electron density and effective thickness for an EP at heliocentric distance of 5–9 R⊙. These maps show trends consistent with an expanding plasma structure: the electron density (ne ∼ 105–106 cm−3) generally decreases with height, while the effective thickness increases. The derived densities are plausible for a CME core at these heights and provide a quantitative snapshot of the state of the EP.
Independent confirmation of our diagnostics approach comes from comparing our results for the event of April 25– 26, 2021 with the broader study by Russano et al. (2024). For the core of the same event, they give an electron density of 2.0 × 105 cm−3. The conversion from Ne to ne in their work requires the geometric assumption that the spatial dimensions along the LoS structure are comparable to those in the PoS. This approach effectively averages over the specific orientation (tilt) of the structure. Their method is therefore independent of the plasma temperature. The agreement between our density range and their values, despite the different approaches, is a strong independent confirmation of our diagnostic technique. Moreover, it means that our assumption of a hot plasma (≥100 kK), which was necessary to obtain a physically realistic effective thickness, leads to a density estimate that is consistent with a temperature-independent method. This supports the conclusion that the prominence material was indeed heated to these high temperatures. However, here we are faced with a problem that the significant presence of the helium D3 emission, confirmed for this event by Heinzel et al. (2023), requires much lower plasma temperatures on the order of 30 kK to be efficiently produced (Heinzel et al. 2020). This may suggest that the EP plasma has a multi-thermal nature, sort of a prominence-corona transition region. To investigate the impact of such a multi-thermal distribution on our UV intensity analysis, we tested a two-component model. We assumed that half of the Lα emission comes from the hot part of EP at T = 150 kK and the other half from the cool part at T = 30 kK where D3 is supposed to be formed. We used our emission-measure method to get EM(cool) and EM(hot) and found that EM(hot) ≫ EM(cool). Because practically all electrons come from the hydrogen ionization (which is almost complete at 150 kK but partial at 30 kK), we assumed that Ne = ⟨ne⟩ Deff, where ⟨ne⟩ is a mean electron density over hot and cool plasmas. The resulting Deff is close to 0.4 R⊙, so still quite realistic comparable to the PoS size of EP visible in VL. This implies that, while cool threads exist and are visible in D3, the ionization budget and total mass of the prominence at these heights are dominated by the hot component.
This study demonstrates the diagnostic potential of combining simultaneous UV and VL coronagraphy achieved for the first time with Metis. However, we recognize the limitations of our approach. The primary assumption is that of a single uniform temperature throughout the structure, whereas real prominences are known to be multi-thermal. Furthermore, our analysis was limited to the northern part of the prominence, where the diagnostic method yielded physically consistent results, and our non-LTE models are based on a simplified 2D slab geometry although the structure is optically thin in the Lα line. Future work should incorporate more realistic physical conditions such as multi-thermal plasma distributions and possibly more complex geometries. We will also need a self-consistent treatment of the hydrogen and helium ionization and line formation.
Looking forward, this work provides a basis for systematic studies of the large population of CMEs observed by Metis. Applying this method to several events will help to produce a more comprehensive statistical picture of the thermodynamic evolution of CME cores.
Acknowledgments
Solar Orbiter is a space mission of international collaboration between ESA and NASA, operated by ESA. Metis was built and operated with funding from the Italian Space Agency (ASI), under contracts to the National Institute of Astrophysics (INAF) and industrial partners. Metis was built with hardware contributions from Germany (Bundesministerium für Wirtschaft und Energie through DLR), from the Czech Republic (PRODEX) and from ESA. S.J. acknowledges the support from the Slovenian Research Agency No. P1-0188. S.J., P.H., P.S., and J.Š. acknowledge support from the grant 25-18282S of the Czech Science Foundation and from the project RVO:67985815 of the Astronomical Institute of the Czech Academy of Sciences. P.H. acknowledges support by the program ’Excellence Initiative - Research University’ for years 2020-2026 at University of Wroclaw, project no. BPIDUB.4610.96.2021.KG. S.J., P.S., and P.H. benefit from the discussions within the ISSI BJ Team “Solar eruptions: preparing for the next generation multi-waveband coronagraphs”. We thank the anonymous referee for useful comments and suggestions that helped to improve the paper.
References
- Akmal, A., Raymond, J. C., Vourlidas, A., et al. 2001, ApJ, 553, 922 [NASA ADS] [CrossRef] [Google Scholar]
- Antonucci, E., Romoli, M., Andretta, V., et al. 2020, A&A, 642, A10 [NASA ADS] [CrossRef] [EDP Sciences] [Google Scholar]
- Bemporad, A., Pagano, P., & Giordano, S. 2018, A&A, 619, A25 [NASA ADS] [CrossRef] [EDP Sciences] [Google Scholar]
- Chen, P. F. 2011, Liv. Rev. Sol. Phys., 8, 1 [Google Scholar]
- Ciaravella, A., Raymond, J. C., Thompson, B. J., et al. 2000, ApJ, 529, 575 [NASA ADS] [CrossRef] [Google Scholar]
- Ciaravella, A., Raymond, J. C., van Ballegooijen, A., et al. 2003, ApJ, 597, 1118 [NASA ADS] [CrossRef] [Google Scholar]
- De Leo, Y., Burtovoi, A., Teriaca, L., et al. 2023, A&A, 676, A45 [NASA ADS] [CrossRef] [EDP Sciences] [Google Scholar]
- De Leo, Y., Burtovoi, A., Teriaca, L., et al. 2025, A&A, 697, A73 [NASA ADS] [CrossRef] [EDP Sciences] [Google Scholar]
- Fineschi, S., Naletto, G., Romoli, M., et al. 2020, Exp. Astron., 49, 239 [Google Scholar]
- Gilbert, H. R., Holzer, T. E., Burkepile, J. T., & Hundhausen, A. J. 2000, ApJ, 537, 503 [NASA ADS] [CrossRef] [Google Scholar]
- Gopalswamy, N., Lara, A., Yashiro, S., & Howard, R. A. 2003, ApJ, 598, L63 [NASA ADS] [CrossRef] [Google Scholar]
- Gunár, S., Schwartz, P., Koza, J., & Heinzel, P. 2020, A&A, 644, A109 [EDP Sciences] [Google Scholar]
- Heinzel, P., & Anzer, U. 2001, A&A, 375, 1082 [NASA ADS] [CrossRef] [EDP Sciences] [Google Scholar]
- Heinzel, P., Susino, R., Jejčič, S., Bemporad, A., & Anzer, U. 2016, A&A, 589, A128 [NASA ADS] [CrossRef] [EDP Sciences] [Google Scholar]
- Heinzel, P., Štěpán, J., Bemporad, A., et al. 2020, ApJ, 900, 8 [NASA ADS] [CrossRef] [Google Scholar]
- Heinzel, P., Jejčič, S., Štěpán, J., et al. 2023, ApJ, 957, L10 [NASA ADS] [CrossRef] [Google Scholar]
- Jejčič, S., & Heinzel, P. 2009, Sol. Phys., 254, 89 [NASA ADS] [CrossRef] [Google Scholar]
- Jejčič, S., Schwartz, P., Heinzel, P., & Gunár, S. 2025, A&A, 696, A14 [NASA ADS] [CrossRef] [EDP Sciences] [Google Scholar]
- Kohl, J. L., Noci, G., Cranmer, S. R., & Raymond, J. C. 2006, A&A Rev., 13, 31 [NASA ADS] [CrossRef] [Google Scholar]
- Müller, D., St. Cyr, O. C., Zouganelis, I., et al. 2020, A&A, 642, A1 [Google Scholar]
- Noci, G., Kohl, J. L., & Withbroe, G. L. 1987, ApJ, 315, 706 [Google Scholar]
- Raymond, J. C., & Ciaravella, A. 2004, ApJ, 606, L159 [Google Scholar]
- Romoli, M., Antonucci, E., Andretta, V., et al. 2021, A&A, 656, A32 [NASA ADS] [CrossRef] [EDP Sciences] [Google Scholar]
- Russano, G., Andretta, V., De Leo, Y., et al. 2024, A&A, 683, A191 [NASA ADS] [CrossRef] [EDP Sciences] [Google Scholar]
- Schmieder, B., Guo, Y., Moreno-Insertis, F., et al. 2013, A&A, 559, A1 [NASA ADS] [CrossRef] [EDP Sciences] [Google Scholar]
- Susino, R., & Bemporad, A. 2016, ApJ, 830, 58 [Google Scholar]
- Webb, D. F., & Howard, T. A. 2012, Liv. Rev. Sol. Phys., 9, 3 [Google Scholar]
- Withbroe, G. L., Kohl, J. L., Weiser, H., Noci, G., & Munro, R. H. 1982, ApJ, 254, 361 [Google Scholar]
All Tables
All Figures
|
Fig. 1. Simultaneous Metis VL (left) and Lα (right) images of the EP on April 26, 2021, at 01:05 UT. |
| In the text | |
|
Fig. 2. Zoomed region of the selected brightest points in Stokes I inside the prominence. Points in the northern leg are highlighted in orange, while those in the southern leg are highlighted in yellow. The brightest pixel is marked in green, corresponding to the selection in Heinzel et al. (2023). |
| In the text | |
|
Fig. 3. Physical parameters of the EP as a function of projected distance from the solar disk center, calculated at 32 selected points along its northern leg. Top panels: Observational values before subtraction of the D3 contribution: Stokes I (left) and ratio Q/I (right). Bottom: Column density after subtracting the helium D3 contribution (left based on the zero-magnetic field case from Heinzel et al. 2023) and the integrated intensity emitted in the Lα line (right). |
| In the text | |
|
Fig. 4. Theoretical integrated intensity emitted in Lα line versus emission measure (EM = ne2Deff) for the range of observed Lα intensities for selected temperatures, marked by colors. The solid lines are linear least-square fits to model data. For a given observed ELα at a temperature of 150 kK, the dashed lines indicate the uncertainty range in EM determination. The horizontal blue line shows the resulting uncertainty in the derived EM at the brightest point. |
| In the text | |
|
Fig. 5. Derived electron density (top) and effective thickness (bottom) as a function of projected distance from the solar disk center for assumed kinetic temperatures of 20, 30, 60, 100, and 150 kK, shown in different colors. |
| In the text | |
|
Fig. 6. Distribution of electron density (top) and effective thickness (bottom) inside the studied prominence structure assuming a uniform kinetic temperature of 150 kK. The points are superimposed on the Metis VL image. |
| In the text | |
Current usage metrics show cumulative count of Article Views (full-text article views including HTML views, PDF and ePub downloads, according to the available data) and Abstracts Views on Vision4Press platform.
Data correspond to usage on the plateform after 2015. The current usage metrics is available 48-96 hours after online publication and is updated daily on week days.
Initial download of the metrics may take a while.