| Issue |
A&A
Volume 708, April 2026
|
|
|---|---|---|
| Article Number | A290 | |
| Number of page(s) | 23 | |
| Section | Extragalactic astronomy | |
| DOI | https://doi.org/10.1051/0004-6361/202554981 | |
| Published online | 14 April 2026 | |
LEGA-C stellar population scaling relations
II. Dissecting mass-complete archaeological trends and their evolution since z ∼ 0.7 with LEGA-C and SDSS
1
INAF-Osservatorio Astrofisico di Arcetri, Largo Enrico Fermi 5, 50126, Firenze, Italy
2
Sterrenkundig Observatorium Universiteit Gent, Krijgslaan 281 S9, B-9000, Gent, Belgium
3
STAR Institute, Université de Liège, Quartier Agora, Allée du six Aout 19c, B-4000, Liege, Belgium
4
Department of Physics and Astronomy and PITT PACC, University of Pittsburgh, Pittsburgh, PA, 15260, USA
5
Dipartimento di Fisica, Università di Trento, Via Sommarive 14, I-38123, Povo, (TN), Italy
6
Department of Astronomy, University of Michigan, 1085 South University Avenue, Ann Arbor, MI, 48109, USA
7
Department of Astronomy and Astrophysics, The Pennsylvania State University, 525 Davey Lab, University Park, PA, 16802, USA
8
Institute for Gravitation and the Cosmos, The Pennsylvania State University, University Park, PA, 16802, USA
9
Institute for Computational and Data Sciences, The Pennsylvania State University, University Park, PA, 16802, USA
10
Kavli Institute for Cosmology, University of Cambridge, Madingley Road, Cambridge, CB3 0HA, UK
11
Cavendish Laboratory – Astrophysics Group, University of Cambridge, 19 JJ Thomson Avenue, Cambridge, CB3 0HE, UK
12
Graduate Institute of Astrophysics, National Taiwan University, Taipei, 10617, Taiwan
13
Department of Physics and Center for Theoretical Physics, National Taiwan University, Taipei, 10617, Taiwan
14
Physics Division, National Center for Theoretical Sciences, Taipei, 10617, Taiwan
15
Space Telescope Science Institute, 3700 San Martin Drive, Baltimore, MD, 21218, USA
16
Department of Astronomy, University of Wisconsin-Madison, 475 N. Charter St., Madison, WI, 53706, USA
★ Corresponding author: This email address is being protected from spambots. You need JavaScript enabled to view it.
Received:
1
April
2025
Accepted:
10
November
2025
Abstract
We analysed a sample of 552 galaxies from the LEGA-C spectroscopic survey (0.6 < z < 0.77), for which we estimated the stellar population parameters by a Bayesian analysis of the stellar absorption features and photometry. We investigated the effect of the current star formation activity on light-weighted mean stellar ages and metallicities and their median trends with stellar mass or velocity dispersion. The bimodality in the global age–mass relation stems from the different age distributions in the quiescent and star-forming populations. No bimodality is observed in the stellar metallicity-mass relation, although quiescent and star-forming galaxies have different distributions in this parameter space. We identified a high-metallicity sequence populated by quiescent and weakly star-forming galaxies. At masses lower than 1010.8 M⊙, the median stellar metallicity–mass relation of star-forming galaxies steepens as a consequence of the increasing scatter towards lower stellar metallicities for galaxies with an increasing specific star formation rate at fixed mass. Relying on a consistent analysis of SDSS DR7 spectra and accounting for aperture corrections, we quantified the evolution of the volume-weighted stellar age and stellar metallicity scaling relations between z = 0.7 and the present. We found negligible evolution in the stellar metallicity–mass relation of quiescent galaxies and for M* > 1011 M⊙ galaxies in general. Lower-mass star-forming galaxies instead have typically lower metallicities than their local counterparts, indicating significant enrichment since z ∼ 0.7 in the low-mass regime. Notably, the median of the stellar ages of the general population and of quiescent galaxies has changed by only 2 Gyr between z = 0.7 and z = 0.1, which is less than expected from cosmic ageing. Some quiescent galaxies must evolve passively to reach the old boundary of the local population. In order to explain the evolution of the median trends, however, both individual evolution through rejuvenation and/or minor merging that affects the outer galaxy regions and population evolution through quenching of massive metal-rich star-forming galaxies are required.
Key words: galaxies: abundances / galaxies: evolution / galaxies: fundamental parameters / galaxies: high-redshift / galaxies: stellar content
© The Authors 2026
 Open Access article, published by EDP Sciences, under the terms of the Creative Commons Attribution License (https://creativecommons.org/licenses/by/4.0), which permits unrestricted use, distribution, and reproduction in any medium, provided the original work is properly cited.
This article is published in open access under the Subscribe to Open model. This email address is being protected from spambots. You need JavaScript enabled to view it. to support open access publication.
1. Introduction
The evolution of the cosmic star formation rate density indicates a pervasive decline in the star formation since z = 1 − 2 (Madau & Dickinson 2014; Driver et al. 2018). The evolution of the mass and number densities of passive and active galaxies indicates that this occurs together with the build-up of the massive quiescent population (Muzzin et al. 2013a; Ilbert et al. 2013; Tomczak et al. 2014; Leja et al. 2020). Massive evolved systems have been found and spectroscopically confirmed already at z = 2 − 4 (Cimatti et al. 2004; Daddi et al. 2005; Fontana et al. 2009; Toft et al. 2012; Whitaker et al. 2013; Glazebrook et al. 2017; Valentino et al. 2020; D’Eugenio et al. 2021), and they are now continuously discovered at increasingly higher redshift (z > 4 up to ∼7) with the sensitive near-IR capabilities of the James Webb Space Telescope (JWST) (Valentino et al. 2023; Carnall et al. 2023, 2024; D’Eugenio et al. 2024; Glazebrook et al. 2024; Weibel et al. 2025; de Graaff et al. 2025). Models of galaxy formation and evolution need to reproduce the number densities of passive galaxies at increasingly higher redshift and the global star formation suppression in more recent epochs.
Complementary and crucial information about the efficiency of star formation and the quenching mechanisms can come from studying the physical properties of the stellar populations in galaxies in addition to the gas component. The metal content in galaxies is the result of the metal production during the star formation, gas and metal loss through outflows driven by supernova (SN) or active galactic nuclei (AGN), and gas infall from the circum-galactic medium (CGM) and inter-galactic medium (IGM), and matter accretion through mergers. Constraints on the mechanisms that regulate the star formation efficiency and quenching can therefore be derived by tracing the metallicities of galaxies with different global properties, in combination with recent and past star formation histories (see for a review Maiolino & Mannucci 2019).
In particular, the metallicity of the stellar populations in galaxies averaged over the galaxy star formation history (SFH), is representative of the chemical enrichment at the peak epoch of mass build-up, which to first order is the (light- or mass-weighted) average age of the stellar populations. These two fossil record properties are known to scale with galaxy mass (e.g. Kauffmann et al. 2003a; Gallazzi et al. 2005; Mateus et al. 2006; Panter et al. 2008; Trussler et al. 2021). Not only are they indicative of the past star formation and assembly histories, but they were also shown to depend on the present-day star formation activity of galaxies. The chemistry of galaxies may thus independently suggest a correlation between the present-day star formation activity and the long-timescale star formation histories (e.g. Chauke et al. 2018; Matthee & Schaye 2018).
In the local Universe, the spectral quality and statistics of surveys such as the Sloan Digital Sky Survey (SDSS) have made it possible to show that quiescent and star-forming galaxies follow different relations between their ages, stellar metallicities (Gallazzi et al. 2005, 2021; Peng et al. 2015; Trussler et al. 2021; Mattolini et al. 2025), and α/Fe with galaxy mass (Gallazzi et al. 2021). It is now established that quiescent galaxies follow tight relations of increasing age, metallicity, and α/Fe with mass (e.g. Worthey et al. 1992; Trager et al. 2000; Bernardi et al. 2005; Thomas et al. 2005; Gallazzi et al. 2006; Graves et al. 2009; Renzini 2006; McDermid et al. 2015). While differing in details, there is general agreement that the stellar metallicities in star-forming galaxies are lower than those in quiescent galaxies of similar mass, and this is more significantly true for lower-mass galaxies. These trends at first glance suggest a more prolonged and less efficient metal enrichment in galaxies with on-going star formation.
The physical origin is still a matter of debate, however. Empirical works and comparisons with analytical models support a scenario in which starvation, that is, the suppression of fresh gas supply, is the dominant quenching route in massive galaxies (Peng et al. 2015; Trussler et al. 2020). Outflows were also suggested to be important contributors, however, or even the only mechanism that drives the lower stellar metallicities of low-mass star-forming galaxies (Spitoni et al. 2017). The reduced effective yield observed in lower-mass galaxies indeed seems to require SN-driven metal-rich outflows coupled with high gas fractions and a low star formation efficiency (Dalcanton 2007). The different global properties of quiescent and star-forming galaxies may also originate from a universal relation with the local conditions, namely the local stellar mass density which drives the efficiency of star formation and the ability of a galaxy to accumulate and retain metals (Bell & de Jong 2000; Kauffmann et al. 2003b; Zhuang et al. 2019; Neumann et al. 2021; Zibetti & Gallazzi 2022; Vaughan et al. 2022), and from the different structural properties of galaxies.
More in general, a secondary dependence of the metallicity of galaxies on the current star formation rate is observed not only for the gas-phase component, as established by several works (e.g. Mannucci et al. 2010; Lara-López et al. 2010; Hunt et al. 2012), but also for the stellar component (Looser et al. 2024). This dependence is also a prediction of semi-analytic models (Fontanot et al. 2021) and cosmological hydrodynamical simulations (Matthee & Schaye 2018; Garcia et al. 2024), and it is associated with the efficiency of stellar feedback and a regulation of the timescales for inter-stellar medium (ISM) enrichment and star formation. Thus, the connection of the stellar metallicity with the star formation activity and the chemical enrichment of the ISM can constrain the gas and metal flow inside and outside galaxies (Dalcanton 2007; Lu et al. 2015; Lian et al. 2018).
The scaling relations observed in the local Universe give us a picture of the present-day population, but a comparison of galaxies of similar mass does not mean a comparison of descendants with their progenitors. Crucial information for distinguishing individual evolutionary paths from population evolution comes from tracing these fossil record scaling relations at increasing redshift. This eventually allows a statistical connection between progenitors and descendants and will increase our ability to resolve the early phases of galaxy formation. Various works traced the metal abundances in stars for quiescent galaxies at intermediate redshift in the field and in clusters (Schiavon et al. 2006; Ferreras et al. 2009; Sánchez-Blázquez et al. 2009; Choi et al. 2014; Gallazzi et al. 2014; Jørgensen et al. 2017) and generally agreed on a mild or absent metallicity evolution of the quiescent population. These results have been corroborated with larger samples from deep spectroscopic surveys such as the Large Early Galaxy Astrophysics Census (LEGA-C) (Beverage et al. 2023; Bevacqua et al. 2024) and VANDELS (Saracco et al. 2023), as well as for the most massive galaxies at higher redshifts (Kriek et al. 2019). In contrast to the apparent lack of a metallicity evolution, evidence for a non passive evolution of the population of quiescent galaxies comes from their ages (or mass-weighted formation epochs), as inferred from a variety of sources and methods: from stellar population analyses of high-resolution spectra and spectral absorption features (Schiavon et al. 2006; Sánchez-Blázquez et al. 2009; Gallazzi et al. 2014; Kaushal et al. 2024), from multi-narrow-band photometry and grism spectroscopy (Díaz-García et al. 2019; Estrada-Carpenter et al. 2019), or indirectly from the evolution of the colour-magnitude plane (Ruhland et al. 2009) and the mass-size plane (Belli et al. 2015) in comparison to those inferred in the present-day Universe.
Although these observational results seem to converge towards a qualitatively similar picture, systematic differences associated with different spectral inference methods, observational diagnostics, and sample selection lead to quantitative differences in the detailed shape of the scaling relations and the mass scale at which deviations from individual or population passive evolution are important. This may in turn affect the comparison with model predictions. To overcome these limitations, it is thus crucial to adopt consistent diagnostics and modelling approaches when galaxies at different redshifts are compared (e.g. Gallazzi et al. 2014; Saracco et al. 2023). Moreover, although diagnostics of the physical properties of stellar populations are more easily measured and interpreted in quiescent galaxies, it is paramount to extend this type of studies to star-forming galaxies at different epochs as well in order to include the potential progenitors of present-day galaxies (Gallazzi et al. 2014; Trussler et al. 2021; Kaushal et al. 2024; Nersesian et al. 2025).
In this work, we studied these issues by relying on a consistent analysis of LEGA-C and SDSS spectra for samples including quiescent and star-forming galaxies. Our intermediate-redshift sample was drawn from the LEGA-C survey (van der Wel et al. 2016, 2021) having robust absorption index diagnostics. The resulting sample of ∼550 galaxies in the redshift range 0.6 < z < 0.77 is representative of the general galaxy population down to 1010.4 M⊙ and of the star-forming population down to 1010 M⊙. We focused on selected spectral absorption features that are chiefly sensitive to age and total stellar metallicity, while being minimally affected by abundance ratio variations and dust. This differs from other works that perform a full spectral fitting (e.g. Barone et al. 2022; Cappellari 2023; Kaushal et al. 2024; Nersesian et al. 2025). These features, coupled with photometry, are interpreted by accounting for complex star formation and chemical enrichment histories and dust attenuation to derive the average ages, stellar metallicities, as well as stellar masses for individual galaxies. Our method and resulting parameter estimates are described in depth by Gallazzi et al. (2026, hereafter Paper I).
With this dataset, we established the scaling relations of stellar population properties at intermediate redshift for quiescent and star-forming galaxies. We addressed whether galaxies differ in the physical parameter space depending on their star formation activity at the epoch of observations. The comparison of galaxies as a function of stellar mass or as a function of stellar velocity dispersion can give us clues on whether quenching and metal enrichment are mainly regulated by the integral of the star formation history or by the central concentration of the total mass (including non-baryonic components). We combined the LEGA-C analysis with consistent physical parameter estimates for a volume- and completeness-weighted sample of galaxies from the SDSS Data Release 7 (DR7) (Mattolini et al. 2025). Importantly, these SDSS estimates derive from aperture-corrected absorption index strengths for individual galaxies (Zibetti et al. 2026). We are thus in the best position to perform a coherent comparison between the stellar population scaling relations at different epochs, 〈z〉 = 0.1 and 〈z〉 = 0.7, to control for potential biases, and to quantify the evolution in ages and stellar metallicities for quiescent and star-forming galaxies separately.
The paper is organised as follows. In Sect. 2 we summarise the sample drawn from the LEGA-C survey and the spectral inference of stellar population parameters as derived in Paper I. Our main results are presented in Sect. 3, where we analyse the volume-weighted age and stellar metallicity scaling relations for quiescent and star-forming galaxies and their possible secondary dependence on the star formation rate. The evolution of the scaling relations between 〈z〉 = 0.7 and 〈z〉 = 0.1, globally and for quiescent and star-forming galaxies separately, are presented in Sect. 4 with a coherent LEGA-C and SDSS analysis. We discuss the implications of our results in Sect. 5 and summarise our findings in Sect. 6. Throughout the paper, we assume a ΛCDM cosmology with H0 = 70 km/s/Mpc, ΩM = 0.3, ΩΛ = 0.7, and a solar stellar metallicity of Z⊙ = 0.0154, and we adopt a Chabrier (2003) initial mass function (IMF).
2. The LEGA-C dataset
2.1. Sample definition
Our sample was drawn from the Data Release 3 (DR3) of the LEGA-C spectroscopic survey (van der Wel et al. 2016, 2021). We required galaxies to belong to the primary sample, the spectrum to satisfy the criterion flag_spec = 0 and sigma_star > 0 and reliable measurements of selected sets of absorption features for stellar metallicity and age estimates to be available, as described in Paper I. Our final working sample (which we call silver sample) comprises 552 unique galaxies, of which 323 have spectral signal-to-noise ratio S/N > 20 and constitute the golden sample. The silver sample covers the redshift range 0.55 < z < 0.77 (as a consequence of wavelength coverage requirement), the stellar mass range 10 ≲ log(M*/M⊙)≲11.5, and a range in star-formation activity representative of the parent LEGA-C sample. Figure 1 illustrates the distribution in the colours (U − V)−(V − J) (the UVJ diagram) and specific star formation rate (SSFR) versus stellar mass (SSFR − M*) of the silver sample (empty symbols) and the golden subsample (filled symbols), compared to the parent LEGA-C sample (small dots). As can be seen from the figure, the requirement of high S/N for the golden sample tends to disfavour lower-mass galaxies and/or red star-forming galaxies.
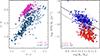 |
Fig. 1. Distribution in U − V vs. V − J (left panel) and SSFR vs. M* (right panel) for the parent LEGA-C sample (small dots) and for the silver (empty symbols) and high-S/N golden samples (filled symbols). In the left panel, galaxies are distinguished into Q (magenta) and SF (blue) based on their distance from the star-forming MS, our default classification (i.e. Q galaxies lie below the dashed line in the right panel). In the right panel, red/blue symbols identify Q/SF galaxies according to their location in the UVJ plane (left and right of the dashed line in the right panel, respectively). |
We adopt a classification of quiescent (Q) and star-forming (SF) galaxies based on their SSFR. We use star formation rate (SFR) estimates based on the UV and 24 μm fluxes (SFRUVIR), following Whitaker et al. (2014), which builds on converting 24 μm fluxes into total IR luminosity with Dale & Helou (2002) templates, and combining it with UV luminosity as prescribed by Bell et al. (2005). These estimates thus account for unobscured and obscured star formation. The SSFR is obtained dividing the SFRUVIR by our estimate of stellar mass. We fit1 a linear relation between the SSFR and stellar mass for galaxies that are classified as star-forming based on the UVJ diagram (Muzzin et al. 2013a) (to the right of the dashed line on the left panel of Fig. 1). The best-fit linear relation is
![Mathematical equation: $$ \begin{aligned} \log (\mathrm{SFR}/M_*[\mathrm{yr}^{-1}]) = A \cdot (\log (M_*/10^{11}\,M_\odot) + B , \end{aligned} $$](/articles/aa/full_html/2026/04/aa54981-25/aa54981-25-eq1.gif) (1)
(1)
where A = −0.64 ± 0.03, B = −9.83 ± 0.01[yr−1]. To avoid being biased by underestimated SFR, hence erroneously including quiescent galaxies in the scatter of the SF sequence, we compute the one-sided scatter considering only positive deviations, which amounts to σ = 0.28 (the total scatter would be 0.32). We consider as quiescent those galaxies deviating by more than 2σ below Eq. (1) (dashed line on the right panel of Fig. 1). This is not meant to provide a new calibration of the star-forming main sequence (MS), which has been derived with larger and more complete datasets (e.g. Whitaker et al. 2017; Leja et al. 2022). Instead, this serves as an operational definition tailored to our sample.
Figure 1 also shows that a cut in SSFR is more conservative for the quiescent population, picking up the reddest galaxies in the UVJ quiescent zone. Conversely, the UVJ passive selection extends to galaxies with higher SSFR. Our silver sample comprises 232 Q and 320 SF galaxies. We comment further on different classification criteria in Appendix A.
2.2. Physical parameter estimates
Estimates of stellar mass, r-band-weighted mean stellar metallicity and age are obtained with our Bayesian Stellar population Analysis code (BaStA, Zibetti et al. 2017; Zibetti & Gallazzi 2022). The code performs a Bayesian analysis of key stellar absorption features and photometry with a comprehensive library of simulated spectra constructed by convolving Simple Stellar Population (SSP) models with randomly generated SFHs, metallicity histories and dust attenuation parameters. The models are based on the SSPs from the 2019 version of the Bruzual & Charlot (2003) (BC03) population synthesis code (CB19), assuming a Chabrier (2003) IMF, convolved with: i) delayed Gaussian SFHs with stochastic bursts (Sandage 1986), ii) chemical enrichment histories Z*(M(t)) following a generalised leaky box model (Erb 2008), and attenuated by dust following Charlot & Fall (2000). A full description of the model library can be found in Mattolini et al. (2025) and Paper I.
As observational constraints, we consider subsets of indices that include at least one age-sensitive index (among D4000n, Balmer absorption lines Hβ and HδA+HγA) and at least one metal-sensitive index (among [MgFe]′, [Mg2Fe], [MgFe50]′, [MgFe52]′), that have negligible dependence on α/Fe. Using galaxies for which all the indices are available, we checked that the chosen subsets of indices predict physical parameter estimates that agree with each other within a few hundredths of a dex, with a scatter comparable to or smaller than the mean parameter uncertainties. Thus we are confident that parameters derived with different indices, among our choices, are consistent within the uncertainties. We use the revised measurements of absorption indices provided in Paper I from the emission-line-subtracted DR3 spectra and accounting for duplicate observations. In addition to absorption indices, we add constraints from the rizYJ photometry from Muzzin et al. (2013b). By comparing these observables with the whole model library, we derive for each galaxy probability density functions of stellar mass, light (and mass)-weighted mean ages and stellar metallicities. We refer the reader to Paper I for details on the methods, the observational constraints and the modelling assumptions, as well as a discussion of potential sources of bias, but we provide here a summary of the bulk uncertainties.
Statistical uncertainties on individual estimates are on average 0.16 dex for light-weighted age, 0.12 dex for stellar mass, 0.17/0.34 dex for stellar metallicity for silver Q and SF galaxies respectively. We also quantify systematic uncertainties associated with different modelling assumptions within our method, in particular regarding the functional form of the continuous SFH, the metallicity history and the base population synthesis models. We found that stellar metallicity is subject to larger systematics (0.28/0.34 dex for Q/SF) as a result of changes in stellar population synthesis (SPS) models (from BC03 to CB19), chemical enrichment histories (from constant metallicity along the SFH to increasing with the mass formed) and star formation histories (from declining exponential to delayed Gaussian), while light-weighted ages can change by −0.18/−0.13 dex due to SFH assumptions (being younger assuming a delayed Gaussian functional form). Moreover, we compare our physical parameter estimates with those obtained on the same sample from independent fits with Prospector (Nersesian et al. 2025) and Bagpipes (Kaushal et al. 2024), which adopt different SPS models and assumption on SFH and metallicity. The offset between different light-weighted age estimates is typically within 0.1 dex, but non constant with age as a consequence of different SFH assumptions. The scatter in age estimates between the three codes is ∼0.16/0.25 dex for Q/SF galaxies. The typical uncertainties on light-weighted ages are 0.15/0.15 dex from BaStA, 0.02/0.03 dex from Prospector, 0.01/0.03 dex from Bagpipes. For stellar metallicity the scatter between the estimates from the three codes is 0.24/0.4 dex for Q/SF galaxies, to be compared with the average uncertainty of 0.16/0.25 dex from BaStA, 0.03/0.04 dex from Prospector, 0.02/0.05 dex from Bagpipes. The uncertainties quantified with BaStA thus typically account for more than 60% of the scatter, compared to ∼10% from Prospector or Bagpipes. We thus consider uncertainties from BaStA to be more representative of the underlying degeneracies. In previous works, we have checked that BaStA uncertainties are well-calibrated and consistent with the scatter between input and retrieved parameters in mock spectra (Rossi 2025). The reader is referred to Appendices D and E of Paper I for a more in-depth discussion. We comment in Appendix A on the robustness in the general trends for Q and SF galaxies, despite the significant one-to-one variability. The substantial differences in the estimates from different approaches highlight the necessity to adopt the same modelling framework when comparing different redshifts, as we aim to do in this work with a consistent SDSS analysis.
2.3. Statistical weights
Finally, we apply statistical weights to correct for incompleteness and selection biases. In particular we consider i) a volume correction, because of the K-band magnitude selection of LEGA-C (the Vcor parameter in DR3 from van der Wel et al. 2021), ii) a completeness correction to account for the representativeness of the observed LEGA-C sample with respect to the parent sample (the Scor parameter in DR3 from van der Wel et al. 2021, the product of the two is called Tcor), and finally iii) a spectroscopic correction (w_spec) which accounts for incompleteness in the plane of rest-frame U − V vs. absolute g-band luminosity (as observational proxy of physical parameters plane) due to our sample selection based on the availability of selected absorption features (see Paper I for more details). Throughout the paper we present as reference scaling relations those obtained by applying these weights to the silver sample (Tcor × w_spec_silver). We present also the median trends obtained from the un-weighted golden sample as a control on higher-quality measurements.
3. The dependence on the current star formation activity
In Paper I, we have presented the global scaling relations of light-weighted mean stellar age and metallicity. The distribution in age revealed the presence of two sequences transitioning around a stellar mass of 1011 M⊙ or a velocity dispersion of ∼230 km/s. As opposed to age, stellar metallicity shows a shallow increase with stellar mass or velocity dispersion at the massive end, and a steepening at lower masses associated with an increased scatter towards low metallicities, without a clear bimodality. Here we investigate how the current star formation activity and, in particular, whether a galaxy is quiescent or not and its SSFR, influences the location of 〈z〉 = 0.7 galaxies in the stellar metallicity-mass and age-mass planes. In the local Universe a few studies have shown that quiescent and star-forming galaxies differ not only in their mean ages, as expected from the more prolonged and continuing star formation activity, but also in their stellar metallicities with quiescent galaxies being systematically more metal-rich than equally massive star-forming galaxies below a certain stellar mass (Gallazzi et al. 2005; Peng et al. 2010; Gallazzi et al. 2021; Trussler et al. 2020; Mattolini et al. 2025).
Here we explore whether and to what extent the difference in stellar populations of quiescent and star-forming galaxies holds at intermediate redshift. We compare scaling relations with stellar mass and velocity dispersion for Q and SF galaxies. We comment on the robustness of our results against different stellar population parameter estimates and different SFR calibrations in Appendix A.
3.1. Trends with stellar mass
The upper panels of Fig. 2 display the age–mass and stellar metallicity–mass relations for the silver LEGA-C sample colour-coded for the SSFR, after applying LOESS-smoothing2. To better quantify and visualise the variation of SSFR as a function of the stellar population parameters, we computed partial correlation coefficients of the original (non-smoothed) SSFR (black vectors in the lower right corner), following Scholz-Díaz et al. (2024). The red vector indicates the direction of maximal increase of SSFR in the age–mass and metallicity–mass planes. We see the expected trend of decreasing SSFR with increasing age at fixed stellar mass. The partial correlation coefficients indicate a stronger correlation of SSFR with age at fixed mass (ρ = −0.70 ± 0.04) than with stellar mass at fixed age (ρ = −0.26 ± 0.07). We also detect a gradient of decreasing SSFR along the stellar metallicity–mass relation, though the correlation with metallicity at fixed mass (ρ = −0.33 ± 0.07) is weaker than with mass at fixed metallicity (ρ = −0.41 ± 0.06). The larger statistics of LEGA-C confirm the trends with SSFR that were seen in the smaller sample of Gallazzi et al. (2014) with different modelling assumptions.
 |
Fig. 2. Luminosity-weighted mean age (left panels) and mean stellar metallicity (right panels) as a function of stellar mass and of SSFR for LEGA-C galaxies at z ≈ 0.7. Upper panels: Data points colour-coded by SSFR after applying LOESS-smoothing. The black vectors in the lower right corner are proportional to the partial correlation coefficients computed as in Scholz-Díaz et al. (2024), and the red vector indicates the direction of maximal increase of SSFR. The grey vectors correspond to a reference correlation coefficient of 0.7. Middle panels: Q galaxies (circles) and SF galaxies (stars), colour-coded by their SSFR, without smoothing. The filled symbols highlight galaxies in the golden subsample. The filled squares show the median age and median metallicity in bins of stellar mass 0.2 dex wide and with at least 5 galaxies (grey for the weighted silver sample, black for the non-weighted golden galaxies). The error bars indicate the 16–84 percentile range of each distribution (errors on the median are smaller). The median age-mass trends are fit with a linear relation (Eq. (2)), while the median metallicity–mass trends are fit with the functional form as in Eq. (3). The solid grey lines show the fit to the silver median relations, with extrapolation shown by the dashed lines. Bottom panels: Direct comparison of the volume and completeness-weighted median relations for Q (magenta) and SF (blue) galaxies in the silver sample. |
In the middle panels of Fig. 2, we show the distributions for Q (circles) and SF (stars) galaxies separately (golden galaxies highlighted by filled symbols), with colour-coding reflecting the SSFR of individual galaxies. By comparing these with the top panels, we notice that the average trends in SSFR result from the superposition of quiescent and star-forming galaxies in the high-metallicity, old-age part of the galaxy distribution, and a lack of quiescent galaxies at lower metallicities/younger ages.
Median ages/metallicities in bins of stellar mass are shown by filled squares (grey for silver sample applying volume and completeness weights, black for golden sample without weights; see Table B.1). Quiescent and star-forming galaxies follow two different sequences in luminosity-weighted mean age and stellar mass (left panels). Simple linear fits of the form
 (2)
(2)
describe the trends well, indicating a steeper relation for Q with respect to SF galaxies (Table 1). Over about an order of magnitude in stellar mass, the luminosity-weighted mean age of Q galaxies increases by ∼3 Gyr, while that of SF galaxies by only ∼800 Myr. The Q and SF age sequences remain distinct almost across the whole mass range probed, and they reach similar ages between 1.5 and 2 Gyr at masses below 1010.5 M⊙ with less than 1 ± 0.3 Gyr difference.
We checked that mass-weighted mean ages show similar trends. In particular we find that for Q and SF galaxies, the slope of their respective age–mass relations are consistent within less than 1σ when weighing in mass or in light. The zero-point of the relation for Q galaxies is higher by 0.04 ± 0.02 dex when weighing in mass, while for SF galaxies it is higher by 0.15 ± 0.04 dex. These shifts bring the median mass-weighted age of SF galaxies to overlap with that of Q galaxies at log(M*/M⊙)≤1010.7. This suggests that, despite their different (recent) SFHs, the bulk of the stellar populations of Q and SF galaxies below 1010.7 M⊙ formed at similar epochs. This is not the case for the more massive galaxies for which the mean formation epoch, approximated by the mass-weighted mean age, differs by 3 Gyr (Δ(log〈Age〉) = 0.41 ± 0.14 dex) between Q and SF galaxies.
Quiescent galaxies follow a very shallow mass–metallicity relation, with an increase in median metallicity of 0.15 dex over an order of magnitude in stellar mass. We notice an increased scatter towards low metallicities in the most massive bin. This is associated with few massive Q galaxies whose sub-solar metallicity is derived from fitting only the [MgFe50]′ index among the metal-sensitive indices (instead of [Mg2Fe] and/or [MgFe]′). The lack of other Mg-Fe composite indices for the sub-solar-metallicity Q galaxies prevents a robust assessment of potential bias, although we note that their Fe4383 absorption index would indicate metallicities closer to or slightly above solar. Nevertheless, only 20% of the Q galaxies fit with only [MgFe50]′ have sub-solar metallicity. Excluding all the galaxies with only [MgFe50]′ from the analysed sample would thus seem like an arbitrary choice. We rather keep these galaxies and only caution that the scatter of Q galaxies towards low metallicities at the high-mass end could be overestimated. In any case, the overall trend and fit to the mass-metallicity relation is not affected by these galaxies.
The star-forming galaxies display a steeper relation with larger scatter, and they are responsible for the change in slope around 1010.8 M⊙ observed in the general population (Fig. 8 of Paper I). Star-forming galaxies reach stellar metallicities as high as those of Q galaxies, with median values consistent within 1σ with those of Q galaxies, only above 1011 M⊙. At lower masses they show a small but systematic offset to lower metallicities with respect to Q galaxies. A simple linear fit is not adequate for the SF mass–metallicity relation, and we chose to adopt the same sigmoidal function as we adopted for the global population (Equation (1) of Paper I),
 (3)
(3)
where  is the characteristic mass of inflection, A represents the dynamical range of the relation, B regulates the extent of the inflection range, and C is simply A ⋅ tanh(B ⋅ (11.5/log M*)) so that
  gives the zero-point of the metallicity at 1011.5 M⊙. We report the fitted parameters in Table 2.
Fit to the median age and metallicity as a function of stellar mass for the general population.
Recently, Looser et al. (2024) found the difference in stellar metallicity between quiescent and star-forming galaxies to result from a continuous secondary dependence of stellar metallicity on SFR. In Fig. 3 we trace the median stellar metallicity as a function of stellar mass for silver galaxies separated into bins of distance from the MS in SSFR (Eq. (1)).
 |
Fig. 3. Top panel: SSFR vs. stellar mass for silver galaxies, divided into bins of distance from the relation fit to UVJ star-forming galaxies (dashed line, Eq. (1)). Bottom panel: luminosity-weighted mean stellar metallicity as a function of stellar mass for LEGA-C silver sample (grey points). The filled squares show the median stellar metallicity in bins of stellar mass (0.3 dex wide and with at least 5 galaxies), weighted by Tcor × w_spec_silver, for galaxies in different bins of distance from the MS (as illustrated in the top panel). The error bars represent the weighted 16th and 84th percentiles. The unweighted median trends would be very similar to those shown here, but with narrower inter-percentile ranges, in particular for the intermediate-SSFR sub-sample. |
As already discussed, Q galaxies (deviating by more than 2σ below the MS; magenta and violet points) populate only the high (super-solar) metallicity portion of the diagram with negligible dependence on SSFR and display a shallow relation with mass. Conversely, especially below 1011 M⊙, galaxies closer to or on the MS are spread over a larger range in stellar metallicity (with increased downward scatter) than galaxies with lower SSFR, leading to a systematic shift towards lower average stellar metallicities with increasing SSFR, at fixed stellar mass. Galaxies with low stellar metallicity (log〈Z*/Z⊙〉 <−0.5) have the highest SSFR. These general trends are robust against different SFR estimates, as we discuss in Appendix A. This trend is indicative of a secondary dependence of the stellar metallicity on the SFR, at fixed mass, qualitatively similar to the Fundamental Metallicity Relation (FMR) for the gas-phase metallicity (e.g. Mannucci et al. 2010). Assessing the significance of the correlation would require a proper treatment of the asymmetric uncertainties in the low-metallicity regime as well as a larger statistical sample, however, in order to disentangle the effects of measurement errors and sample variance. Interestingly, Muñoz López et al. (2025) recently collected a sample of almost 400 galaxies at redshift 0.1 < z < 0.9 from different MUSE surveys and found that galaxies with younger ages and a larger number of (recent) star formation episodes show a larger scatter towards low stellar metallicities, suggesting a picture in line with our results.
3.2. Trends with stellar velocity dispersion
Figure 4 shows how age and stellar metallicity correlate with stellar velocity dispersion σ* in alternative to stellar mass (Fig. 2). Symbols and colours have the same meaning as in Fig. 2. The medians and percentiles are reported in Table B.2. We see qualitatively similar trends of increasing age and metallicity with velocity dispersion as observed with stellar mass, but a few differences are worth noticing. We see a clear gradient in SSFR along the age–σ* relation. The partial correlation analysis shows that SSFR has a stronger correlation with age (ρ = −0.63 ± 0.05) than with velocity dispersion (ρ = −0.35 ± 0.07). In the Z* − σ* plane the SSFR varies along the median relation with a stronger dependence on σ* (ρ = −0.57 ± 0.05) than on metallicity (ρ = −0.31 ± 0.07), especially at σ* > 102.2 km/s. The correlation between the SSFR and the stellar population parameters, age and metallicity, appears similarly strong when viewed at fixed stellar mass as at fixed velocity dispersion.
 |
Fig. 4. Luminosity-weighted mean age (left panels) and mean stellar metallicity (right panels) as a function of stellar velocity dispersion for LEGA-C silver galaxies. Upper panels: Data points colour-coded by their SSFR after applying LOESS-smoothing. The black vectors in the bottom-right corner are proportional to the partial correlation coefficients computed as in Scholz-Díaz et al. (2024), and the red vector indicates the direction of maximal increase of SSFR. The grey vectors indicate a reference correlation coefficient of 0.7. Middle panels: Q galaxies (circles) and SF galaxies (stars), colour-coded by their individual SSFR. The filled symbols highlight galaxies in the golden subsample. The median trends in bins of σ* (0.1 dex wide and with at least 5 galaxies) are shown by grey (black) squares for the weighted silver (non weighted golden) sample. The linear fits to the median silver points are shown by solid lines (dashed lines for the extrapolation outside the median data points). Bottom panels: comparison of the median trends for Q (magenta) and SF galaxies (blue) in the silver sample. The error bars represent the 16–84 percentile range of each distribution. |
The (mild) increase in metallicity of Q galaxies with σ* is equivalent to that with M*, corresponding to ∼0.2 dex increase in log Z* per dex in M* or σ*. The relation between the median stellar metallicity and velocity dispersion can be well described by a linear function, also for the SF galaxies. The linearly decreasing median metallicity with decreasing σ* is in fact the result of an increasing scatter in stellar metallicity from high to low σ*. We fit a linear function to the metallicity-velocity dispersion trends,
 (4)
(4)
Star-forming galaxies follow a similar sequence as quiescent galaxies of decreasing metallicity and increasing scatter towards lower-mass/lower-σ* galaxies. They have similar slopes within the uncertainties, but the normalisation is ∼0.15 ± 0.08 dex lower for the SF galaxies. The best-fit parameters of the linear function are summarised in Table 4.
Linear fit to the age and stellar metallicity as a function of velocity dispersion.
The light-weighted ages display a rather sharp transition from young ages of 1–2 Gyr to old ages of 3–5 Gyr around log σ* ∼ 2.3. We adopt the same linear function as in Eq. (4) to describe the age-velocity dispersion relation (see Table 4). The median age of SF galaxies increases only mildly with σ* below log σ* ∼ 2.3, while that of Q galaxies has a steeper increase with σ*. The zero-point of the relations for Q and SF galaxies differs by 2.5 Gyr (0.4 ± 0.04 dex). The median ages of SF galaxies with the highest velocity dispersions might be only 1.5 Gyr (0.24 ± 0.09 dex) younger than Q galaxies with a similar σ*, however. We checked that similar considerations apply, to a larger degree, to the mass-weighted ages. On the contrary, the two sequences of Q and SF galaxies remain well separated at fixed stellar mass also at the highest masses, with a difference of 3 Gyr (0.41 ± 0.14 dex) between Q and SF at M* = 1011.5 M⊙ (Fig. 2). This suggests that the epoch when the bulk of the stellar population has formed depends primarily on the stellar velocity dispersion, regardless of whether galaxies are currently forming stars or not. The different star-formation histories and star formation efficiencies, however, lead to higher stellar metallicities in quiescent galaxies than in star-forming galaxies of similar velocity dispersion.
For the quiescent population, across the range σ* = 150 − 250 km/s we find a similar increase in stellar metallicity of ∼0.1 dex as found by Beverage et al. (2023) and Borghi et al. (2022) (which is based though on the DR2 data reduction), and a slightly stronger increase in light-weighted age of 0.2 dex with respect to these studies.
4. The evolution of the scaling relations from z = 0.7 to z = 0.1
Having established the stellar population scaling relations for the massive galaxy population at z = 0.7, we now wish to quantify how much they have changed in the last 5 Gyr of cosmic history. To this end, we compare the relations obtained in LEGA-C with those of the local galaxy populations from SDSS DR7.
4.1. The SDSS DR7 data and sample
For a proper comparison with our LEGA-C analysis, we take the revised estimates of stellar population parameters for SDSS DR7 that we derived in Mattolini et al. (2025), which adopt the same modelling assumptions and consistent observational constraints as in this work. Specifically, the LEGA-C and SDSS spectra are interpreted with the same library of SFHs, metallicity histories and dust attenuation parameters, based on the CB19 models. For SDSS we fit the u, g, r, i, z photometry together with the optimal set of absorption features (D4000n, Hβ, HδA+HγA, [MgFe]′, [Mg2Fe]). In addition to the model library adopted, there are other two novelties in the SDSS analysis with respect to our previous catalogs (Gallazzi et al. 2005, 2021): i) statistical weights including completeness and volume corrections and the treatment of duplicate spectroscopic observations, and ii) the corrections for aperture effects. Galaxies with more than one spectroscopic observation are included only once and their physical parameters are estimated from the S/N-weighted mean of the observed spectral indices (in addition to the unique photometry). More importantly, corrections for aperture effects are applied to the absorption indices of each spectrum. The effect of a fixed, finite aperture, sampling a redshift-dependent portion of the galaxy light, on the measured absorption indices has been estimated in a statistical sense using simulations based on the CALIFA integral field spectroscopy (Zibetti et al. 2026). These corrections were then applied to each SDSS galaxy, based on its redshift, measured index value in the fibre, rest-frame g − r colour, absolute r-band Petrosian magnitude and half-light radius, resulting in an estimate of the absorption index integrated over the full galaxy extent. These aperture corrections typically act in the sense of reducing the D4000n while increasing the strength of Balmer-line indices (Hβ, HδA+HγA); the metal-sensitive indices ([MgFe]′, [Mg2Fe]) have typically negative corrections (Zibetti et al. 2026). In terms of stellar populations, this leads in general to an overall decrease both in the age and in the metallicity estimates, as expected from the predominant stellar population gradients observed in nearby galaxies. Notably, the strongest corrections apply to “green valley” galaxies, with a net effect of enhancing the young population at the expenses of the old one. On the metallicity side, aperture corrections produce a steepening of the mass-metallicity relation, especially at the low-mass end. A thorough analysis of these effects is presented in Mattolini et al. (2025).
The SDSS DR7 sample is limited to galaxies with good quality photometric flags, 0.005 ≤ z ≤ 0.22, 0 < VDISP < 375 km/s3, 14.5 ≤ rPetro ≤ 17.77. We further apply a cut in spectral S/N at S/N > 10 and S/N > 20 for age and stellar metallicity respectively, following Mattolini et al. (2025). The resulting samples of 354 977 galaxies with S/N ≥ 10, and 89 852 galaxies with S/N ≥ 20 are compared to the purely magnitude limited photometric catalog of Blanton et al. (2005) in the rest-frame colour–absolute-magnitude plane, in order to derive statistical corrections for incompleteness induced by our spectroscopic selection. For both S/N limits, the sample is representative and statistically weighted to reproduce a volume complete selection down to M★ ∼ 109 M⊙.
In Figs. 5 and 7 we compare the age and stellar metallicity distributions as a function of stellar mass for LEGA-C galaxies with those for SDSS DR7 galaxies. The contours and the median trends for SDSS are computed weighing galaxies for volume and spectroscopic completeness, as in Mattolini et al. (2025). They should thus be regarded as representative of a volume complete sample, similarly to the median trends of the LEGA-C silver sample. In these figures we show the distributions and trends for the population as a whole (left panels) and for quiescent and star-forming galaxies separately (middle and right panels). LEGA-C galaxies are classified into Q and SF as described in Sect. 2.1. We follow an equivalent approach as for LEGA-C to classify Q and SF galaxies in SDSS: we consider as Q those galaxies that lie more the 2σ below the MS in the SSFR − M* plane. Specifically, we use aperture-corrected SFR estimates based on the Hα emission following Brinchmann et al. (2004). To define the MS we consider galaxies classified as star-forming based on the BPT diagram and we fit a linear relation between their SSFR and M* (see Eq. (7) in Mattolini et al. 2025 and Fig. 6 in Gallazzi et al. 2021). In this way we classify galaxies into Q and SF depending on their relative SSFR with respect to the MS at each redshift. This criterion is also less sensitive to absolute differences in SFR estimates from different diagnostics (see also discussion in Appendix A).
 |
Fig. 5. Comparison of the light-weighted age vs. stellar mass relation for LEGA-C and SDSS galaxy samples for the whole population (left panels) and for Q and SF galaxies separately (middle and right panels, respectively). The SDSS data include corrections for aperture effects, as well as weights for spectroscopic and volume completeness (see text for details). Top row: Data points show LEGA-C golden (filled black and dark points) and silver samples (filled grey and light points). The contours show the distribution for SDSS DR7 S/N > 10 samples, tracing number density levels that enclose 16, 50, 84, 97.5, 99.8, 99.9% of the total density. Middle row: median values of light-weighted age in bins of stellar mass for LEGA-C golden and silver sample (weighted for volume and spectroscopic completeness) and for SDSS, with the same colour-coding as in the top row. The error bars indicate the (weighted) 16–84 percentiles of the distribution. The solid curves show the fit to the median silver points, with the same functional form adopted in Paper I for the whole population (as Eq. (3) for metallicity) and with a linear function (Eq. (2)) for Q and SF galaxies. The dashed lines show the extrapolation beyond the range of the data. Bottom row: Difference in (linear) age between SDSS median points and LEGA-C (golden and silver) median points, with error bars computed from the error on the medians; the solid lines show the differences between the fitted functions in the middle row. The y-axis range extends to 5 Gyr, which corresponds to the cosmic time elapsed between z = 0.7 and z = 0.1, i.e. roughly the expected age difference under pure passive evolution. |
4.2. The evolution in the age-mass relation
In Fig. 5 we clearly see a shift to younger ages from SDSS to LEGA-C, as expected, when comparing the population as a whole (left panels) and Q galaxies (middle panels). The SDSS contours for the population as a whole show a bimodal age distribution with an old and a young sequence, transitioning around 3 − 6 ⋅ 1010 M⊙. This is qualitatively similar to what we observe in LEGA-C at z ∼ 0.7. The SDSS distribution of light-weighted ages extends between 800 Myr and 10 Gyr. LEGA-C galaxies probe only the high-mass end because of the K-band selection. The old age envelope for LEGA-C (for the whole population and for Q galaxies only) reaches 6.3 Gyr, consistent with the Universe age at z = 0.7 and almost 4 Gyr younger than the SDSS old envelope. The median ages as a function of stellar mass for the SDSS general population can be well described by the same sigmoidal function adopted for LEGA-C (Eq. (3), see also Paper I). Compared to LEGA-C, the SDSS median relation is shifted to older ages (0.16 ± 0.04 dex offset in the characteristic age at 1011.5 M⊙) and displays a shallower transition between young and old occurring across a stellar mass of  , which is 0.27 ± 0.16 dex smaller than at 〈z〉 = 0.7 (see Table 3). The value of the SDSS transition mass defined by our functional fit is consistent within 1σ with the value of 1010.80 ± 0.05 M⊙ obtained in Mattolini et al. (2025) for the mass where the number densities of young and old galaxies are equal.
The bottom left panel of Fig. 7 shows the difference in linear age between the median of galaxies at z = 0.1 in SDSS and the median of galaxies at z = 0.7 in LEGA-C, in bins of stellar mass. Remarkably, over the whole mass range probed, the difference in the median age of the galaxy populations is significantly lower than the elapsed cosmic time of ∼5 Gyr, assuming the average redshift 〈z〉 = 0.7 for LEGA-C and the average redshift 〈z〉 = 0.1 for SDSS. The age difference is largest (∼2.3 Gyr) around a stellar mass of 1011 M⊙, it decreases to 1 Gyr at lower stellar masses and flattens to values slightly below 2 Gyr at higher stellar masses. While the overall galaxy distribution, and in particular the old age envelope, shifts to older ages almost consistently with passive ageing, the median of the population evolves more mildly.
We further distinguish the contribution to the population evolution from quiescent and star-forming galaxies (middle and right columns). As in Fig. 2, we adopt a linear function (Eq. (2)) to describe the median trends with mass. The best-fit linear relations for each sample are reported in Table 1. The median ages of LEGA-C Q galaxies show a slightly steeper (by 0.12 ± 0.02) increasing trend with stellar mass with respect to SDSS, leading to an apparent evolution ranging from 1.5 to 2 Gyr in the mass range between 3 ⋅ 1011 and 3 ⋅ 1010 M⊙. Perhaps surprisingly, the largest age difference manifests for least massive Q galaxies, rather than for the most massive ones. This age difference is in any case notably smaller than the cosmic ageing, i.e. what would be expected in the case of simple passive evolution4. The light-weighted ages of SF galaxies at z ∼ 0.7 show the same increasing trend with stellar mass as for z ∼ 0.1 SF galaxies, with an almost constant offset of ∼0.2 dex (∼1 Gyr). This suggests that, over the mass range 1010 − 1011 M⊙, the formation of new stars and the ageing of the old stellar components balance to a 1 Gyr apparent evolution. There is a hint of a larger age difference between LEGA-C and SDSS SF galaxies at the highest masses, which is driven by the deviation from the linear trend in SDSS. This could be caused by the older ages of the bulges in local massive star-forming galaxies.
We also notice that the age difference between LEGA-C SF galaxies and SDSS Q galaxies ranges between 2 and 4 Gyr from low to high masses, i.e. close to the expected 5 Gyr difference in case of passive evolution, as illustrated in Fig. 6 (orange stars). A rapid quenching of the massive z = 0.7 star-forming galaxies would thus bring them onto the median age-mass relation of local quiescent galaxies.
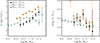 |
Fig. 6. Difference in median light-weighted age (left panel) and median stellar metallicity (right panel) as a function of stellar mass between quiescent and star-forming galaxies at different redshifts. We compare Q and SF galaxies in LEGA-C (black circles) and in SDSS (green circles), as well as SF galaxies in LEGA-C with Q galaxies in SDSS, their potential descendants (orange stars). |
4.3. The evolution in the stellar metallicity-mass relation
Fig. 7 compares the distribution in light-weighted mean stellar metallicity as a function of stellar mass for LEGA-C and SDSS galaxies. Contrary to age, no bimodality is observed in the stellar metallicity distribution as a function of stellar mass neither in the SDSS nor in the LEGA-C samples. LEGA-C and SDSS galaxies occupy the same region in the stellar-metallicity–mass plane over the common mass range, though LEGA-C shows an apparently larger scatter towards low metallicities. The median stellar metallicity of SDSS galaxies is fully consistent with that of equally massive LEGA-C golden galaxies for masses above ∼1010.7 M⊙. In the (weighted) silver sample, however, a difference in the medians of ≲0.1 dex is detected (0.12 ± 0.03 dex difference between medians at log M* ≥ 11). A marked decrease in median metallicity from 〈z〉 = 0.1 SDSS galaxies to 〈z〉 = 0.7 LEGA-C galaxies is observed below log M* = 10.5, with differences between the two populations of at least 0.2 dex.
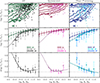 |
Fig. 7. Comparison of the light-weighted stellar metallicity vs. stellar mass relation for LEGA-C and SDSS galaxy samples for the whole population (left panels) and for Q and SF galaxies separately (middle and right panels, respectively). Symbols, colours, and contours have the same meaning as in Fig. 5. The SDSS sample is restricted to S/N > 20 galaxies, weights are applied to correct for volume and spectroscopic completeness and the data are corrected for aperture effects. The bottom row shows the difference in (log) stellar metallicity between SDSS and LEGA-C median trends with error bars computed propagating the error on the medians. The dashed line at a difference equal to zero is drawn to guide the eye. |
Considering only the Q galaxies, we see that the distribution and median trend of stellar metallicity with mass are highly consistent between the two redshifts over the mass range 3 ⋅ 1011 − 3 ⋅ 1010 M⊙. The possible steepening of the stellar metallicity–mass relation of LEGA-C Q galaxies below 1010.5 M⊙ is driven by only few points in the silver sample and may suffer from incompleteness in the LEGA-C Q sample at these masses because of the LEGA-C K-band selection and should thus be regarded with caution. The similarity of the stellar metallicity distribution for SDSS and LEGA-C Q galaxies suggests that any addition of young stars to the population of quiescent galaxies that explains the small age evolution (Fig. 5), through either rejuvenation episodes in already quiescent galaxies or minor mergers or newly quenched galaxies, occurs in such a way to maintain galaxies on the same mass–metallicity relation. It is interesting to note that for the highest mass bin (M* ≳ 1011.5 M⊙) the median metallicity of LEGA-C Q galaxies is ∼0.22 ± 0.1 dex lower than for equally massive SDSS Q galaxies. A similar fall in total metallicity was reported in Carnall et al. (2022) from the analysis of the stacked spectrum of log M*/M⊙ > 10.8, 1 < z < 1.3 quiescent galaxies in VANDELS. This suggests that the most massive galaxies population change in age and stellar metallicity. We caution though that the median metallicity in the highest-mass bin may be biased low by a few galaxies whose sub-solar metallicity estimate is based only on the [MgFe50]′ index (see Sect. 3.1).
The right panels of Fig. 7 show that at both redshifts, the mass–stellar metallicity relation of SF galaxies reaches a similar characteristic metallicity at M* = 1011.5 M⊙ as the quiescent population (log(Z*/Z⊙)∼0.4; see Table 2). At lower masses the relation is steeper for the 〈z〉 = 0.7 SF population than at 〈z〉 = 0.1. This leads to an increase in the median stellar metallicity of SF galaxies at masses below 1010.8 M⊙ by 0.05 up to more than 0.2 dex, across this redshift interval. Interestingly, the difference in median stellar metallicity as a function of mass between Q and SF galaxies is similar at both redshifts. It ranges between 0.03 and 0.2 dex from 1011.5 to 1010 M⊙ for SDSS, a behaviour that is quantitatively similar (consistent within 1σ), despite with larger uncertainties, for LEGA-C. This is illustrated in Fig. 6 (green open circles and filled black circles). The median difference in metallicity between quiescent and star-forming galaxies is thus not affected by the evolution of individual galaxies and of the population.
4.4. Addressing systematics on the inferred evolution
A few sources of systematics may limit the comparison between the stellar population scaling relations observed at different redshifts and the inferred evolution. We reduce at our best the potential biases by applying a consistent modelling and treatment of the data in the two samples.
In particular, we account for observational biases due to aperture effects. We can assume that aperture effects are not significant for LEGA-C spectra, which are collected from 8″ × 1″ slits with typical seeing comparable to the galaxy size in many cases. When the slit is aligned with the galaxy’s major axis within 45° (which happens in ∼50% of the ‘primary’ LEGA-C DR3 sample), the slit geometry allows to collect a good portion of the galaxy’s light, with median slit loss of 45% (van Houdt et al. 2021), compared to the 70% of SDSS fibre loss. Moreover, the seeing smooths out gradients (D’Eugenio et al. 2020), so that aperture corrections are not expected to be relevant for absorption features and inferred properties to within the typical uncertainties. Aperture effects can instead be significant for the SDSS fibre observations (see Zibetti et al. 2026). Because of stellar population gradients, accounting for aperture effects typically reduces the average galaxy ages. The resulting scaling relations with and without corrections for aperture effects are qualitatively consistent, but differ in detail. In particular, accounting for aperture effects leads to an enhanced bimodality in the age-mass relation and a transition mass 0.15 dex higher than without aperture corrections, and a steeper mass–metallicity relation at low masses (these changes are discussed extensively in Mattolini et al. 2025, and Zibetti et al. 2026). To quantify the impact of aperture effects, we checked the resulting evolution in the scaling relations that one would obtain when analysing the original SDSS DR7 spectral indices without applying aperture corrections. The difference in light-weighted age between the SDSS and LEGA-C Q galaxy population would increase by ∼1 Gyr with respect to the aperture-corrected estimates, ranging between 2 and 3 Gyr from 1011 to 1010 M⊙. A reverse trend would be observed for SF galaxies, with the age difference between the two redshifts going from 1 to 2 Gyr with increasing mass. Regarding stellar metallicity, we would obtain typically more metal-rich stellar populations at low masses, resulting in flatter scaling relations at 〈z〉 = 0.1. We would find the median stellar metallicity of LEGA-C galaxies to be lower than their local counterparts already at masses of 1011 M⊙ and below, significantly for SF galaxies (0.1 ± 0.05, i.e. 2σ above zero) and marginally for Q galaxies (only 1σ above zero).
This shows that tracing stellar populations over consistent areas of the galaxies, hence including also more external regions than probed by the SDSS fibre, has important implications for the inferred evolution. The effect of including aperture corrections suggests that the addition of younger stellar components, which reduces the mean age evolution, pertains to a large extent to the outer galaxy regions, but does not explain alone the deviation from simple passive evolution.
In addition to aperture corrections, we checked what the effect on the inferred age evolution could be of degeneracies with dust attenuation in the age estimates of Q galaxies (see also Appendix C of Paper I). As a test, we performed a fit to SDSS and LEGA-C restricting the model library to models with dust attenuation Ag < 0.2 mag. Overall the Age-Mass relation of Q galaxies in LEGA-C shifts by 0.1 dex systematic, while that of SDSS Q galaxies becomes shallower and shifts by < 0.1 dex at high masses and ∼0.2 dex at lower masses, leading to a difference in light-weighted age between SDSS and LEGA-C of 1.5 − 3 ± 0.4 Gyr in the mass range 1010.2 − 1011.2 M⊙. The mass–metallicity relation of LEGA-C Q galaxies becomes flat, as a result of an increased scatter towards lower metallicities at all masses, while that of SDSS Q galaxies slightly steeper, leading to an apparent metallicity evolution of 0.15 ± 0.05 dex at high masses > 1011 M⊙. Therefore, limiting the range of dust attenuations would alleviate (but still not remove) the deviation from passive ageing, but at the same time would require metallicity evolution.
Finally, we repeat the comparison between SDSS and LEGA-C by adopting our previous model library as used in Gallazzi et al. (2005) and Gallazzi et al. (2014). The old library adopted a constant metallicity along the SFH, an exponentially declining law for the smooth component of the SFH, and BC03 SSPs. The comparison thus incorporates differences in the SPS models and in SFH and metallicity assumptions. While the overall trends are robust against the different modelling, we find quantitative differences. We refer the reader to Appendix D of Paper I and to Mattolini et al. (2025) for an in-depth presentation of the effect of each modelling ingredient on LEGA-C and SDSS, respectively. In particular, with the old library we find that the age-mass relation for Q galaxies would become flatter and would move to slightly older ages for SDSS and LEGA-C, implying an ages difference between the two samples of only 0.8 ± 0.3 Gyr at the massive end and up to 2.8 ± 1 Gyr at lower masses; the relation for SF galaxies would show a roughly mass-independent evolution of 1.3 ± 0.3 Gyr. The mass–metallicity relations would have a similar shape as in our default modelling but shifted to lower metallicities by 0.2 − 0.3 dex (due to changing from BC03 to CB19 models). The resulting difference between SDSS and LEGA-C would be systematically higher by 0.2 dex for Q and SF galaxies. The indication of non passive evolution of the z = 0.7 galaxy population accompanied by a mild stellar metallicity increase is thus a robust result, even assuming different priors (delayed-gaussian versus exponentially-declining continuous SFH; evolving versus constant stellar metallicity) and SPS models (CB19 versus BC03), at least in our modelling framework. Exactly how the non-passive evolution occurs, however, is subject to modelling assumptions and highlights the need of making consistent comparisons between different samples and redshifts.
5. Discussion
5.1. Different age sequences of quiescent and star-forming galaxies?
In Paper I we have shown that the light-weighted ages of z = 0.7 galaxies follow a non-linear trend with stellar mass. In this work we show that this non-linear trend derives from the superposition of different distributions depending on the (S)SFR, so that quiescent and star-forming galaxies follow different distributions in the physical parameters space. Distinguishing galaxies into quiescent and star-forming, based on their SSFR, we find that they follow two separate linear trends in log〈Age〉r−log M*: a steeper relation for Q galaxies and a flatter one for SF, converging at relatively low masses (around the completeness limit of 1010.4 M⊙ for our Q galaxies sample). We observe a young and an old sequence also as a function of stellar velocity dispersion, with a rather sharp transition at log σ*/km s−1 ∼ 2.3. This trend with velocity dispersion and the transition regime are very similar to those found for the full LEGA-C sample in Nersesian et al. (2025) with ages estimated from Prospector, and in Cappellari (2023) with pPXF. Cappellari (2023) argues that the regime log σ*/km s−1 ∼ 2.3 corresponds to a ‘quenching boundary’ such that the star formation histories of galaxies above it have no young component (age ≲1 Gyr). By contrast, in our work, we find that the young and the old sequences as a function of velocity dispersion are not trivially associated with SF and Q galaxies: at log σ*/km s−1 > 2.3 SF galaxies have similarly old ages as Q galaxies, with an age difference of 1.5 Gyr (0.24 ± 0.09 dex), as opposed to how they compare at fixed M*. Similar considerations apply to mass-weighted ages: at fixed velocity dispersion SF and Q galaxies have more similar mass-weighted ages than they do at fixed stellar mass. On the one hand, this suggests that stellar velocity dispersion is a better predictor of the main stellar formation epoch than stellar mass is, as we found in Paper I and as works in the local Universe also indicate (e.g van der Wel et al. 2009; Graves et al. 2009; Wake et al. 2012; McDermid et al. 2015). In this sense, our result is consistent with what is discussed in Cappellari (2023). On the other hand, the fact that the old sequence contains both passive and star-forming galaxies, i.e. galaxies with different recent star formation histories, is in seeming contradiction with a ‘quenching boundary’.
5.2. A redshift-independent stellar metallicity difference between quiescent and star-forming galaxies
We find that Q and SF galaxies at 〈z〉 = 0.7 reach the same stellar metallicity of log〈Z*/Z⊙〉r ∼ 0.4 at 1011.5 M⊙, but their median relations start to deviate at lower masses: the relation for Q galaxies is flat in the mass range log M*/M⊙ = 10.5 − 11.4, while the relation for SF galaxies is steeper and with larger scatter. This leads to an average difference in metallicity of 0.11 dex between Q and SF galaxies, with a trend of larger differences (of ∼0.2 dex or more) for galaxies with log(M*/M⊙)≤11. We verified that the difference in stellar metallicity between quiescent and star-forming galaxies and its trend with mass, is stable against changes in the modelling assumptions, namely in the SFH priors and SPS models. We stress, however, that there is no sharp separation between Q and SF galaxies in the stellar metallicity–mass relation. Above stellar masses of 1011 M⊙ there is significant overlap of galaxies with different SSFR, ranging from quiescent galaxies up to galaxies with log(SSFR/yr−1) = −9.5. It is only for lower masses that a systematic shift towards lower average stellar metallicities with increasing SSFR is observed. The steepening of the stellar metallicity–mass relation has to be attributed in particular to galaxies that are on or above the star-forming MS (typically with log(SSFR/yr−1) > − 10). We can translate the SSFR into a birthrate parameter as b = SSFR ⋅ T ⋅ (1 − R) (see Gavazzi et al. 2002; Brinchmann et al. 2004), which tells us how much the current star formation activity is with respect to the average past SFR, assuming for simplicity an average return mass fraction of R = 0.5 and a time span T equal to the age of the Universe at 〈z〉 = 0.7. Galaxies with b < 0.3 follow a very similar stellar metallicity–mass relation. It is only for galaxies with b ≥ 0.3 that the stellar metallicity is lower than the one of equally-massive galaxies with a more quiescent star formation activity.
Bevacqua et al. (2024) discusses the stellar metallicity–mass relation as the result of a lack of massive metal-poor galaxies among the quiescent population, rather than a simple increase in the average metallicity as a function of stellar mass. They introduce the concept of a MEtallicity-Mass Exclusion zone (MEME), whereby the stellar metallicity of massive quiescent galaxies is bounded between a constant upper limit and an increasing-with-mass lower limit. We find a similar asymptotic behaviour of the mass–metallicity relation towards high masses, as also found by other works in the gas-phase mass–metallicity relation. Notably in Bevacqua et al. (2024) galaxies tend to accumulate at the upper boundary of their metallicity grid, an effect that is seen to a much less extent in our analysis, likely thanks to the larger range of metallicities in our adopted models. Most importantly, we do not find a Metallicity-Mass Exclusion zone for the Q population alone, which instead distributes along a relatively tight and flat sequence. A MEME-like relation as discussed in Bevacqua et al. (2024) is instead possibly observed in the mass–metallicity relation of the population as a whole and in SF galaxies in particular, regardless of whether they are selected on the basis of SSFR or of UVJ location. In our analysis, such a behaviour is more evident in the distribution of stellar metallicity as a function of velocity dispersion rather than of stellar mass. It originates from an increasing scatter in metallicity towards lower mass/lower velocity dispersion. Our analysis shows that the SSFR contributes to this scatter.
This secondary dependence on SSFR resembles qualitatively the Fundamental Metallicity Relation that connects the gas-phase metallicity with the stellar mass and SFR, observed for star-forming galaxies (e.g. Mannucci et al. 2010; Curti et al. 2020). The gas-phase metallicity is the end-point of the whole star formation and gas accretion histories, hence reflects the physical conditions of the gas coeval with the current star formation activity. Stellar metallicity instead is averaged over the whole SFH and traces metal enrichment at the earlier epochs of mass build-up. Therefore the physical origin of a dependence on SFR of the gas or the stellar component likely stems from mechanisms that operate on different timescales. An inverse relation between stellar metallicity and SSFR at given mass may be consistent either with substantial recent star formation fed by metal-poor gas inflows, or with less efficient metal recycling in galaxies with more extended and rising SFH.
A relation connecting the three parameters, stellar metallicity, stellar mass and (S)SFR, alike the one for the gas-phase metallicity, has also been predicted by semi-analytic models and cosmological hydrodynamical simulations. In particular the semi-analytic model GAEA, which includes a revised treatment of feedback from star formation, predicts a change in stellar mass–metallicity relation for galaxies with different SFR (different slope) or different SSFR (different normalisation) (Fontanot et al. 2021). Similar predictions are obtained from cosmological hydrodynamical simulations such as Illustris, TNG and EAGLE, all featuring a treatment of the star-forming interstellar medium to simulate smooth stellar feedback (Garcia et al. 2024). The dependence of stellar metallicity on star-formation rate is interpreted as a result of a correlation between the stellar and gas-phase metallicities and a balance between the timescales of ISM enrichment and of star formation.
A systematic and mass-dependent difference in stellar metallicity between quiescent and star-forming galaxies at fixed stellar mass has been shown to exist in the local Universe first by Peng et al. (2015) using the stellar population catalog from Gallazzi et al. (2005), and then confirmed by Trussler et al. (2020) and by Gallazzi et al. (2021), using independent or updated estimates for SDSS DR7, and by Vaughan et al. (2022) using IFU-integrated stellar population properties from SAMI. Moreover, a secondary dependence on SFR has been observed in star-forming galaxies by Looser et al. (2024) based on MaNGA. The different degree of metal enrichment between quiescent and star-forming galaxies has been interpreted as suggestive of relatively long quenching timescales associated with gas starvation processes that suppress metal-poor gas supply to the galaxy (Peng et al. 2015; Trussler et al. 2020). Other possible physical origins have been discussed, including a different efficiency of metal-loaded outflows in addition to starvation (Trussler et al. 2020) or in combination with different timescales of gas infall in present-day passive versus star-forming galaxies (Spitoni et al. 2017). Moreover, galaxy structure as traced by mass density profile (Zibetti & Gallazzi 2022) and total potential well as traced by σ* or M*/R (Barone et al. 2022; Vaughan et al. 2022; Looser et al. 2024) appear to be important parameters to interpret the different stellar metallicities, possibly more fundamental than stellar mass, posing into question the necessity for long quenching timescales to reach high stellar metallicities.
In this work, we find that the secondary dependence of stellar metallicity on SFR is already in place at 〈z〉 = 0.7. A small but systematic difference in stellar metallicity between Q and SF galaxies is observed either at fixed M*, at low masses, or at fixed σ*. This differs from what we observed for luminosity-weighted age (see section above), suggesting a different link to stellar and total mass (as traced by velocity dispersion) for star formation and chemical enrichment (Scholz-Díaz et al. 2022; Barone et al. 2022). Interestingly, the observed difference in stellar metallicity and its trend with mass are quantitatively consistent within 1σ with what we find in the local Universe from SDSS (see Fig. 6 and Mattolini et al. 2025) and what found by the previously-cited works. This would suggest that its physical origin is independent of cosmic epoch at least over the last 5 Gyr.
5.3. The non simple passive evolution of massive galaxies in the last 5 Gyr
We have traced the evolution of the age and stellar metallicity scaling relations in the last 5 Gyr, by comparing our results on LEGA-C galaxies at 〈z〉 = 0.7 with those derived analysing SDSS galaxies at 〈z〉 = 0.1 with the same modelling assumptions. We take advantage of the new characterisation of the scaling relations in the local Universe from the analysis of Mattolini et al. (2025) on SDSS DR7 spectra, which builds upon Gallazzi et al. (2005) and Gallazzi et al. (2021) making important changes: i) spectral indices are corrected for aperture effects following Zibetti et al. (2026), and ii) completeness and Malmquist bias are accounted for with proper statistical weights. The LEGA-C and SDSS analysis are therefore consistent in the observational diagnostics used and in the modelling assumptions adopted, removing possible sources of bias in their comparison and the inferred evolution.
In case of fully passive evolution of galaxies, that is in absence of any addition of new stars either through star formation or through merging/accretion, we expect the stellar metallicity to remain constant. Indeed, after star formation ceases, the luminosity-weighted stellar metallicity that is inferred from the integrated galaxy spectra may decrease with the ageing and fading of the younger stellar populations and the relative emergence of the older, metal-poorer stellar generations, in case of a general increase of the metallicity in galaxies along the SFH. This picture is in agreement with the lack of evolution (within 1.5σ), or even a very slightly negative evolution, in the median stellar metallicity between the quiescent galaxy populations at z = 0.7 and at z = 0.1 that we observe. The lack of significant changes in the total stellar metallicities and in the abundances of Mg and Fe of intermediate-redshift quiescent galaxies with respect to local quiescent galaxies is in agreement with results from Beverage et al. (2023) (which revises abundance estimates from Beverage et al. 2021, based on LEGA-C DR2 data), Bevacqua et al. (2023) and from Saracco et al. (2023) (extending to z ∼ 1.4 quiescent galaxies from VANDELS). Notice that this does not exclude merging in the massive galaxy population. In fact, because of the shallow slope of the stellar metallicity–mass relation for quiescent galaxies at masses above 1010.5 M⊙, mergers would leave the integrated metallicity constant within the uncertainties.
The median stellar metallicity of star-forming galaxies shows a modest increase between the z = 0.7 population and the z = 0.1 population at masses above 1010.8 M⊙. This is mostly associated with a reduction in the scatter towards low metallicities. Despite the large uncertainties, we find tentative evidence that the scatter in the z = 0.7 mass–metallicity relation is related to the galaxy SSFR, in the sense that more actively star-forming galaxies, at fixed mass, spread towards lower stellar metallicities (see Sect. 5.2). These galaxies are thus more prone to increase their metallicity over the 5 Gyr of cosmic evolution if their star formation continues at similar levels. At high masses, the gas-phase Fundamental Metallicity Relation flattens, so that the average gas-phase metallicity has little dependence on the (S)SFR (Curti et al. 2020; Mannucci et al. 2010; Hunt et al. 2012), thus producing a constant increase in the stellar metallicity also for highly-star-forming galaxies. At lower stellar masses, we observe that the z = 0.7 mass–metallicity relation of SF galaxies declines more steeply than the z = 0.1 counterpart, leading to a median metallicity difference of 0.05 dex up to more than 0.2 dex in the mass range log(M*/M⊙) = 10.8 − 10. At first order approximation, this would imply a significant metal enrichment in the average star-forming population. Again, owing to the gas-phase FMR, which shows a stronger anti-correlation between gas-phase metallicity and SFR in this lower-mass regime with respect to higher masses5, we expect qualitatively that, while increasing their stellar mass, the more highly star-forming galaxies increase their stellar metallicity more slowly than more quiescent systems, because new stars form out of less enriched ISM. Therefore, we expect that in the massive regime it is the more highly star-forming galaxies to contribute to the stellar metallicity evolution of the SF population, while at lower masses a larger contribution is expected from lower-SFR galaxies. A proper quantification of the expected increase in stellar metallicity requires simulations, which is beyond the scope of this paper.
Along these lines, Peeples & Somerville (2013) constrained the evolution in the stellar metallicity-mass relation of the present-day star-forming galaxies, assuming population-average SFH based on stellar mass and SFR estimates at different redshifts (Leitner 2012) and the FMR (Mannucci et al. 2010). At z = 0 and z = 0.7, their predicted mass-metallicity relations (MZR) are similar to, but shallower than, our LEGA-C and SDSS observations, so that their stellar metallicities over-predict our measurements at low stellar mass. Interestingly, the resulting evolution in the stellar MZR between z = 0.7 and z = 0 is consistent with our observed evolution in the median relation for masses log(M*/M⊙) > 10.5. Moving to lower masses the difference between the two redshifts increases more slowly with respect to our findings, reaching 0.2 dex at 1010 M⊙. This qualitative agreement is remarkable considering the different approaches. Peeples & Somerville (2013) predictions apply strictly to present-day star-forming galaxies and to their progenitors, which may not be representative of the whole star-forming population at intermediate redshift, if a fraction of the z = 0.7 star-forming population would quench and join the passive population today. Moreover, as mentioned above, our measured median difference for masses below 1010.3 M⊙ may be overestimated.
Predictions from the GAEA semi-analytic models (Fontanot et al. 2021) also lead to a shallower stellar mass–metallicity relation for star-forming galaxies than what we observe. In agreement with our result, GAEA also predicts a mass-dependent evolution of the stellar metallicity, but more modest with respect to our findings. We find agreement for masses > 1010.7 M⊙, but at lower masses the GAEA semi-analytic model predicts a metallicity difference between intermediate and low redshift of only 0.1 dex at fixed mass. The low stellar mass regime is thus crucial to constrain different models.
Notice that the difference in the median stellar metallicity between LEGA-C SF galaxies and SDSS Q galaxies ranges between 0.1 and 0.3 dex, increasing with decreasing mass (Fig. 6, orange stars). This difference is larger than the difference between LEGA-C SF galaxies and SDSS SF galaxies. This means that, if the whole SF population sampled by LEGA-C were to quench its star formation activity and join the Q population, it should experience an even larger metal enrichment than if it continued forming stars. Based on empirical predictions of the mass–metallicity relation of the star-forming progenitors of present-day passive galaxies, Trussler et al. (2020) argued, through closed-box and leaky-box models, that these progenitors should go through an extended phase of starvation. Quenching timescales of ∼3 Gyr are approximately compatible with a median difference in age of ∼2.5 Gyr between z = 0.7 SF galaxies and local Q galaxies, as we observe. We should be cautious though in over-interpreting the metallicity trends and differences at masses below 1010.3 M⊙, which is the LEGA-C mass completeness limit at z = 0.6 (van der Wel et al. 2021). In fact, below this mass LEGA-C may be missing U − V red galaxies, and we should regard the mass–metallicity relation of SF galaxies at these masses as representative only of the U − V < 1.5 galaxies.
In conclusion, the stellar metallicities of z = 0.7 massive galaxies are overall compatible with passive evolution of the quiescent population and with the average cosmic SFH and gas-phase metallicity evolution for the star-forming population. The age distribution shows that a fraction of z = 0.7 quiescent galaxies should evolve passively to reach the old boundary of the z = 0.1 quiescent population. However, a pure passive evolution of the quiescent population is not reflected in the evolution of mean stellar age–stellar mass relation, which we observe to be significantly lower than the expected elapsed time between 〈z〉 = 0.7 and 〈z〉 = 0.1. Though quantitatively different, our analysis supports, with larger statistics and improved mass coverage, what we found in Gallazzi et al. (2014). How can these two apparently contradicting results on age and metallicity evolution be reconciled?
An important point of our SDSS analysis is the correction for aperture effects. We estimate that the overall effect of accounting for total age and metallicity estimated through consistent physical apertures in SDSS is to reduce the apparent age evolution by 1 Gyr. This suggests that the addition of younger stellar components, through continued or revived star-formation or through minor merging/accretion, pertains to some extent to the outer regions of passive galaxies and of massive galaxies in general. Minor dissipation-less mergers are considered an important channel of galaxy growth after quenching as inferred from the evolution of the mass-size relation (Bezanson et al. 2009; van der Wel et al. 2009; Belli et al. 2015), the rotational support (Bezanson et al. 2018) and orbital structure (D’Eugenio et al. 2023) of quiescent galaxies. However, this is not enough and additional evolution in the central regions of individual galaxies may be allowed. Small frosting or rejuvenation of star formation could be accommodated as it is not expected to alter the measured (mass-weighted) stellar metallicity (Serra & Trager 2007; Saracco et al. 2023). Similarly, merging of similar-mass galaxies would move galaxies along the stellar mass axis but not on the stellar metallicity axis.
Moreover, we should remind that comparing scaling relations at different redshifts does not mean tracing the evolutionary tracks of individual galaxies. Scaling relations are statistical “demographic” distributions, whose evolution is determined by the flow of galaxies in the multi-dimensional parameter space. The observed evolution in the scaling relations is the combination of the change in mass and physical properties of individual galaxies and the change in the number density of the population as a function of mass and SFR, including galaxies that fall off the K-band selection (hence mass completeness limit) of LEGA-C. The number and mass density of the global massive galaxy population has seen a modest increase since z ∼ 1 (Pannella et al. 2009; Moustakas et al. 2013; Leja et al. 2020). However, this seemingly small evolution hides a differential evolution of the quiescent and star-forming populations. Studies find the number density and mass density of massive quiescent galaxies to increase by 20–50% (depending on mass threshold and analysis) since z ∼ 1 to the present (Moustakas et al. 2013; Muzzin et al. 2013a; Díaz-García et al. 2024), while that of massive star-forming galaxies has remained constant (Muzzin et al. 2013a) or decreased (Moustakas et al. 2013; Haines et al. 2017). This is also supported by the decrease of the mass range where we observed the age–mass relation to transition from being dominated by old quiescent galaxies to being dominated by young star-forming galaxies (1.8 times smaller in SDSS than in LEGA-C). Our results suggest that quenching of star-forming galaxies over the last 6–8 Gyr contributes to the build-up of the massive quiescent population even at masses above 1011 M⊙.
We find that the massive SF galaxies in LEGA-C have a larger spread in stellar metallicities than Q galaxies, but on average they have metallicities as high as the Q population at z = 0.7 and at z = 0.1. In particular, the high-metallicity SF galaxies are those with the lowest SFR at fixed mass. They are thus good candidates for joining the local quiescent population by exhausting their metal-rich (as expected from the FMR) ISM.
6. Summary and conclusions
We analysed volume- and completeness-weighted age and stellar metallicity scaling relations for quiescent and star-forming galaxies at redshift 0.6 < z < 0.77 from the LEGA-C survey. We used stellar population parameter estimates derived from our BaSta fitting code that interprets optimally selected sets of stellar absorption features, in combination with rest-frame optical photometry, in a Bayesian framework with a library of spectral models based on complex star formation and metal enrichment histories and dust attenuations (presented in Paper I). We selected a silver subset of the LEGA-C sample, based on the availability of key absorption features sensitive to age and metallicity. This subset comprised 232 quiescent and 320 star-forming galaxies. The second high-S/N golden subset comprised 148 quiescent and 175 star-forming galaxies, where quiescent and star-forming were defined based on their distance from the SFR − M* MS. We studied the different physical parameters of the stellar populations for intermediate-redshift galaxies according to their current star formation activity. We list our results below.
-
Quiescent and star-forming galaxies follow two different sequences in age as a function of stellar mass, and their median ages are more similar when they are viewed at a fixed velocity dispersion.
-
Quiescent galaxies follow a shallow mass–metallicity relation above M* = 1010.5 M⊙. Star-forming galaxies have similar metallicities as quiescent galaxies above 1011 M⊙, but are typically less metal-rich at lower masses. Similar differences are observed as a function of the velocity dispersion.
-
At masses lower than 1011 M⊙, the mass–metallicity relation of star-forming galaxies becomes steeper and the scatter increases, which is associated with the SSFR (relative to the SF MS), so that galaxies with a higher SFR than in their past have a lower stellar metallicity at fixed mass on average.
We further compared our LEGA-C results with the volume-weighted and aperture-corrected scaling relations obtained through a consistent analysis of SDSS DR7. We found similarities and differences in the physical parameter distribution of the massive galaxy populations at the two epochs.
-
We found a bimodal distribution in light-weighted mean age at both redshifts, which originates from the different age–mass relations of quiescent and star-forming galaxies and from the varying abundance of the two populations as a function of mass.
-
The transition mass in the age–mass relations increases by 0.27 ± 0.16 dex from ⟨ z⟩ = 0.1 to ⟨ z⟩ = 0.7. Despite the different definitions, this is similar to the evolution in the mass, where passive and star-forming galaxies are equally dominant (Muzzin et al. 2013b; Haines et al. 2017).
-
While the upper age envelope of the local population (as a whole and for quiescent galaxies alone) is ∼4 Gyr older than for LEGA-C, the median SDSS age–mass relation is shifted to older ages by only 1–2 Gyr for the star-forming and the quiescent population.
-
The stellar metallicity–mass relation shows a negligible evolution between the two redshifts for masses above 1011 M⊙ and for quiescent galaxies at all masses we probed.
-
For the star-forming galaxy population, we observed a steepening of the mass–metallicity relation starting at masses lower than 1011 M⊙ downwards, and possibly an increased scatter towards lower metallicities at all masses in LEGA-C with respect to SDSS. This implies at face value a metallicity evolution of less than 0.05 dex for masses above 1010.8 M⊙ that possibly exceeds 0.2 dex for lower masses down to 1010 M⊙.
-
The relative differences between the mass–metallicity relation of quiescent and star-forming galaxies are quantitatively similar at z = 0.7 and z = 0.1.
These results suggest that the stellar metallicities of massive galaxies are set at early times. When we combine secondary trends of SFR and expectations from the gas-phase FMR, the continued recycling of metals in star-forming galaxies is expected to affect the final stellar metallicity in a different way for massive and less massive galaxies. Our analysis showed that the combined measurements of ages and stellar metallicities of the quiescent and the star-forming populations can provide important constraints on the quenching and continued build-up of the massive galaxy population even in the more quiet Universe over the past 6 Gyr. The observed evolution in the scaling relations supports a scenario in which both individual evolution through rejuvenation or merging and population evolution through quenching need to occur.
A detailed comparison with model predictions and with the observed evolution in galaxy number densities and SFR can shed light on the relative contribution of continued star formation and of progenitor bias. We also remind that the ability of stellar population models to resolve the early SFH is progressively more limited in older systems (Zibetti et al. 2024). It is thus crucial to connect the local estimates and those at intermediate redshift in a continuous way, as will be possible with surveys such as WEAVE-StePS (Iovino et al. 2023b) and 4MOST-StePS (Iovino et al. 2023a), on the one hand, and to constrain the ages and abundances of large samples of galaxies at increasing redshifts (z > 1), for which high-sensitivity spectrographs in the NIR are essential, such as NIRSpec/JWST (e.g. the SUSPENSE program, Beverage et al. 2025; Slob et al. 2024), PFS/Subaru (Greene et al. 2022), and MOONS/VLT (the MOONRISE survey, Maiolino et al. 2020), MOSAIC/ELT (Evans et al. 2015) in the near future. While the amount and quality of data at increasingly higher redshifts increases, we stress that it is paramount to apply a consistent analysis in terms of modelling assumptions and observational constraints for a proper comparison of results at different redshifts.
Data availability
The median relations provided in Tables B.1 and B.2 are available at the CDS via https://cdsarc.cds.unistra.fr/viz-bin/cat/J/A+A/708/A290
Acknowledgments
We thank the referee for their detailed and constructive report that helped improve the presentation of the analysis and results. We thank Fabio Fontanot for discussion on the GAEA model predictions for the mass-metallicity relation. ARG and LSD acknowledge support from the INAF-Minigrant-2022 “LEGA-C” 1.05.12.04.01. SZ acknowledges support from the INAF-Minigrant-2023 “Enabling the study of galaxy evolution through unresolved stellar population analysis” 1.05.23.04.01. PFW acknowledges funding through the National Science and Technology Council grants 113-2112-M-002-027-MY2. LSD is supported by the “Prometeus” project PID2021-123313NA-I00 of MICIN/AEI/10.13039/501100011033/FEDER, UE. This paper and related research have been conducted during and with the support of the Italian national inter-university PhD programme in Space Science and Technology.
References
- Barone, T. M., D’Eugenio, F., Scott, N., et al. 2022, MNRAS, 512, 3828 [NASA ADS] [CrossRef] [Google Scholar]
- Bell, E. F., & de Jong, R. S. 2000, MNRAS, 312, 497 [NASA ADS] [CrossRef] [Google Scholar]
- Bell, E. F., Papovich, C., Wolf, C., et al. 2005, ApJ, 625, 23 [Google Scholar]
- Bell, E. F., Zheng, X. Z., Papovich, C., et al. 2007, ApJ, 663, 834 [Google Scholar]
- Belli, S., Newman, A. B., & Ellis, R. S. 2015, ApJ, 799, 206 [NASA ADS] [CrossRef] [Google Scholar]
- Bernardi, M., Sheth, R. K., Nichol, R. C., Schneider, D. P., & Brinkmann, J. 2005, AJ, 129, 61 [Google Scholar]
- Bevacqua, D., Saracco, P., Boecker, A., et al. 2024, A&A, 690, A150 [NASA ADS] [CrossRef] [EDP Sciences] [Google Scholar]
- Bevacqua, D., Saracco, P., La Barbera, F., et al. 2023, MNRAS, 525, 4219 [NASA ADS] [CrossRef] [Google Scholar]
- Beverage, A. G., Kriek, M., Conroy, C., et al. 2021, ApJ, 917, L1 [NASA ADS] [CrossRef] [Google Scholar]
- Beverage, A. G., Kriek, M., Conroy, C., et al. 2023, ApJ, 948, 140 [NASA ADS] [CrossRef] [Google Scholar]
- Beverage, A. G., Slob, M., Kriek, M., et al. 2025, ApJ, 979, 249 [Google Scholar]
- Bezanson, R., van Dokkum, P. G., Tal, T., et al. 2009, ApJ, 697, 1290 [Google Scholar]
- Bezanson, R., van der Wel, A., Pacifici, C., et al. 2018, ApJ, 858, 60 [NASA ADS] [CrossRef] [Google Scholar]
- Blanton, M. R., Schlegel, D. J., Strauss, M. A., et al. 2005, AJ, 129, 2562 [NASA ADS] [CrossRef] [Google Scholar]
- Borghi, N., Moresco, M., Cimatti, A., et al. 2022, ApJ, 927, 164 [NASA ADS] [CrossRef] [Google Scholar]
- Brinchmann, J., Charlot, S., White, S. D. M., et al. 2004, MNRAS, 351, 1151 [Google Scholar]
- Bruzual, G., & Charlot, S. 2003, MNRAS, 344, 1000 [NASA ADS] [CrossRef] [Google Scholar]
- Cappellari, M. 2023, MNRAS, 526, 3273 [NASA ADS] [CrossRef] [Google Scholar]
- Cappellari, M., McDermid, R. M., Alatalo, K., et al. 2013, MNRAS, 432, 1862 [NASA ADS] [CrossRef] [Google Scholar]
- Carnall, A. C., McLure, R. J., Dunlop, J. S., et al. 2022, ApJ, 929, 131 [NASA ADS] [CrossRef] [Google Scholar]
- Carnall, A. C., McLure, R. J., Dunlop, J. S., et al. 2023, Nature, 619, 716 [NASA ADS] [CrossRef] [Google Scholar]
- Carnall, A. C., Cullen, F., McLure, R. J., et al. 2024, MNRAS, 534, 325 [NASA ADS] [CrossRef] [Google Scholar]
- Chabrier, G. 2003, PASP, 115, 763 [Google Scholar]
- Charlot, S., & Fall, S. M. 2000, ApJ, 539, 718 [Google Scholar]
- Chauke, P., van der Wel, A., Pacifici, C., et al. 2018, ApJ, 861, 13 [NASA ADS] [CrossRef] [Google Scholar]
- Choi, J., Conroy, C., Moustakas, J., et al. 2014, ApJ, 792, 95 [Google Scholar]
- Cimatti, A., Daddi, E., Renzini, A., et al. 2004, Nature, 430, 184 [NASA ADS] [CrossRef] [Google Scholar]
- Cleveland, W. S., & Devlin, S. J. 1988, J. Am. Stat. Assoc., 83, 596 [CrossRef] [Google Scholar]
- Curti, M., Mannucci, F., Cresci, G., & Maiolino, R. 2020, MNRAS, 491, 944 [Google Scholar]
- Daddi, E., Renzini, A., Pirzkal, N., et al. 2005, ApJ, 626, 680 [NASA ADS] [CrossRef] [Google Scholar]
- Dalcanton, J. J. 2007, ApJ, 658, 941 [CrossRef] [Google Scholar]
- Dale, D. A., & Helou, G. 2002, ApJ, 576, 159 [Google Scholar]
- de Graaff, A., Setton, D. J., Brammer, G., et al. 2025, Nat. Astron., 9, 280 [Google Scholar]
- D’Eugenio, C., Daddi, E., Gobat, R., et al. 2021, A&A, 653, A32 [NASA ADS] [CrossRef] [EDP Sciences] [Google Scholar]
- D’Eugenio, F., van der Wel, A., Wu, P.-F., et al. 2020, MNRAS, 497, 389 [CrossRef] [Google Scholar]
- D’Eugenio, F., van der Wel, A., Piotrowska, J. M., et al. 2023, MNRAS, 525, 2789 [CrossRef] [Google Scholar]
- D’Eugenio, F., Pérez-González, P. G., Maiolino, R., et al. 2024, Nat. Astron., 8, 1443 [CrossRef] [Google Scholar]
- Díaz-García, L. A., Cenarro, A. J., López-Sanjuan, C., et al. 2019, A&A, 631, A157 [Google Scholar]
- Díaz-García, L. A., González Delgado, R. M., García-Benito, R., et al. 2024, A&A, 688, A113 [NASA ADS] [CrossRef] [EDP Sciences] [Google Scholar]
- Driver, S. P., Andrews, S. K., da Cunha, E., et al. 2018, MNRAS, 475, 2891 [Google Scholar]
- Erb, D. K. 2008, ApJ, 674, 151 [NASA ADS] [CrossRef] [Google Scholar]
- Estrada-Carpenter, V., Papovich, C., Momcheva, I., et al. 2019, ApJ, 870, 133 [NASA ADS] [CrossRef] [Google Scholar]
- Evans, C., Puech, M., Afonso, J., et al. 2015, arXiv e-prints [arXiv:1501.04726] [Google Scholar]
- Ferreras, I., Pasquali, A., Malhotra, S., et al. 2009, ApJ, 706, 158 [NASA ADS] [CrossRef] [Google Scholar]
- Fontana, A., Santini, P., Grazian, A., et al. 2009, A&A, 501, 15 [NASA ADS] [CrossRef] [EDP Sciences] [Google Scholar]
- Fontanot, F., Calabrò, A., Talia, M., et al. 2021, MNRAS, 504, 4481 [CrossRef] [Google Scholar]
- Gallazzi, A., Charlot, S., Brinchmann, J., White, S. D. M., & Tremonti, C. A. 2005, MNRAS, 362, 41 [Google Scholar]
- Gallazzi, A., Charlot, S., Brinchmann, J., & White, S. D. M. 2006, MNRAS, 370, 1106 [Google Scholar]
- Gallazzi, A., Bell, E. F., Zibetti, S., Brinchmann, J., & Kelson, D. D. 2014, ApJ, 788, 72 [Google Scholar]
- Gallazzi, A. R., Pasquali, A., Zibetti, S., & Barbera, F. L. 2021, MNRAS, 502, 4457 [NASA ADS] [CrossRef] [Google Scholar]
- Gallazzi, A. R., Zibetti, S., van der Wel, A., et al. 2026, A&A, in press, https://doi.org/10.1051/0004-6361/202554922 [Google Scholar]
- Garcia, A. M., Torrey, P., Grasha, K., et al. 2024, MNRAS, 529, 3342 [Google Scholar]
- Gavazzi, G., Boselli, A., Pedotti, P., Gallazzi, A., & Carrasco, L. 2002, A&A, 396, 449 [NASA ADS] [CrossRef] [EDP Sciences] [Google Scholar]
- Glazebrook, K., Nanayakkara, T., Schreiber, C., et al. 2024, Nature, 628, 277 [NASA ADS] [CrossRef] [Google Scholar]
- Glazebrook, K., Schreiber, C., Labbé, I., et al. 2017, Nature, 544, 71 [Google Scholar]
- Graves, G. J., Faber, S. M., & Schiavon, R. P. 2009, ApJ, 693, 486 [CrossRef] [Google Scholar]
- Greene, J., Bezanson, R., Ouchi, M., Silverman, J., & the PFS Galaxy Evolution Working Group 2022, arXiv e-prints [arXiv:2206.14908] [Google Scholar]
- Haines, C. P., Iovino, A., Krywult, J., et al. 2017, A&A, 605, A4 [NASA ADS] [CrossRef] [EDP Sciences] [Google Scholar]
- Hunt, L., Magrini, L., Galli, D., et al. 2012, MNRAS, 427, 906 [NASA ADS] [CrossRef] [Google Scholar]
- Ilbert, O., McCracken, H. J., Le Fèvre, O., et al. 2013, A&A, 556, A55 [NASA ADS] [CrossRef] [EDP Sciences] [Google Scholar]
- Iovino, A., Mercurio, A., Gallazzi, A. R., et al. 2023a, The Messenger, 190, 22 [NASA ADS] [Google Scholar]
- Iovino, A., Poggianti, B. M., Mercurio, A., et al. 2023b, A&A, 672, A87 [NASA ADS] [CrossRef] [EDP Sciences] [Google Scholar]
- Jørgensen, I., Chiboucas, K., Berkson, E., et al. 2017, AJ, 154, 251 [CrossRef] [Google Scholar]
- Kauffmann, G., Heckman, T. M., White, S. D. M., et al. 2003a, MNRAS, 341, 33 [Google Scholar]
- Kauffmann, G., Heckman, T. M., White, S. D. M., et al. 2003b, MNRAS, 341, 54 [Google Scholar]
- Kaushal, Y., Nersesian, A., Bezanson, R., et al. 2024, ApJ, 961, 118 [NASA ADS] [CrossRef] [Google Scholar]
- Kennicutt, R. C., Jr 1998, ARA&A, 36, 189 [NASA ADS] [CrossRef] [Google Scholar]
- Kriek, M., Price, S. H., Conroy, C., et al. 2019, ApJ, 880, L31 [NASA ADS] [CrossRef] [Google Scholar]
- Lara-López, M. A., Cepa, J., Bongiovanni, A., et al. 2010, A&A, 521, L53 [CrossRef] [EDP Sciences] [Google Scholar]
- Leitner, S. N. 2012, ApJ, 745, 149 [NASA ADS] [CrossRef] [Google Scholar]
- Leja, J., Johnson, B. D., Conroy, C., et al. 2019, ApJ, 877, 140 [NASA ADS] [CrossRef] [Google Scholar]
- Leja, J., Speagle, J. S., Johnson, B. D., et al. 2020, ApJ, 893, 111 [Google Scholar]
- Leja, J., Speagle, J. S., Ting, Y.-S., et al. 2022, ApJ, 936, 165 [NASA ADS] [CrossRef] [Google Scholar]
- Lian, J., Thomas, D., Maraston, C., et al. 2018, MNRAS, 474, 1143 [NASA ADS] [CrossRef] [Google Scholar]
- Looser, T. J., D’Eugenio, F., Piotrowska, J. M., et al. 2024, MNRAS, 532, 2832 [NASA ADS] [CrossRef] [Google Scholar]
- Lu, Y., Blanc, G. A., & Benson, A. 2015, ApJ, 808, 129 [Google Scholar]
- Madau, P., & Dickinson, M. 2014, ARA&A, 52, 415 [Google Scholar]
- Maiolino, R., Cirasuolo, M., Afonso, J., et al. 2020, The Messenger, 180, 24 [NASA ADS] [Google Scholar]
- Maiolino, R., & Mannucci, F. 2019, A&ARv, 27, 3 [Google Scholar]
- Mannucci, F., Cresci, G., Maiolino, R., Marconi, A., & Gnerucci, A. 2010, MNRAS, 408, 2115 [NASA ADS] [CrossRef] [Google Scholar]
- Mateus, A., Sodré, L., Cid Fernandes, R., et al. 2006, MNRAS, 370, 721 [NASA ADS] [CrossRef] [Google Scholar]
- Matthee, J., & Schaye, J. 2018, MNRAS, 479, L34 [NASA ADS] [Google Scholar]
- Mattolini, D., Zibetti, S., Gallazzi, A. R., Scholz-Díaz, L., & Pratesi, J. 2025, A&A, 703, A5 [NASA ADS] [CrossRef] [EDP Sciences] [Google Scholar]
- McDermid, R. M., Alatalo, K., Blitz, L., et al. 2015, MNRAS, 448, 3484 [Google Scholar]
- Moustakas, J., Coil, A. L., Aird, J., et al. 2013, ApJ, 767, 50 [NASA ADS] [CrossRef] [Google Scholar]
- Muñoz López, C., Krajnović, D., Epinat, B., et al. 2025, A&A, 702, A146 [Google Scholar]
- Muzzin, A., Marchesini, D., Stefanon, M., et al. 2013a, ApJ, 777, 18 [NASA ADS] [CrossRef] [Google Scholar]
- Muzzin, A., Marchesini, D., Stefanon, M., et al. 2013b, ApJS, 206, 8 [Google Scholar]
- Nersesian, A., van der Wel, A., Gallazzi, A. R., et al. 2025, A&A, 695, A86 [NASA ADS] [CrossRef] [EDP Sciences] [Google Scholar]
- Neumann, J., Thomas, D., Maraston, C., et al. 2021, MNRAS, 508, 4844 [NASA ADS] [CrossRef] [Google Scholar]
- Pannella, M., Gabasch, A., Goranova, Y., et al. 2009, ApJ, 701, 787 [Google Scholar]
- Panter, B., Jimenez, R., Heavens, A. F., & Charlot, S. 2008, MNRAS, 391, 1117 [Google Scholar]
- Peeples, M. S., & Somerville, R. S. 2013, MNRAS, 428, 1766 [Google Scholar]
- Peng, Y.-J., Lilly, S. J., Kovač, K., et al. 2010, ApJ, 721, 193 [Google Scholar]
- Peng, Y., Maiolino, R., & Cochrane, R. 2015, Nature, 521, 192 [Google Scholar]
- Renzini, A. 2006, ARA&A, 44, 141 [NASA ADS] [CrossRef] [Google Scholar]
- Rossi, E. 2025, arXiv e-prints [arXiv:2507.06006] [Google Scholar]
- Ruhland, C., Bell, E. F., Häußler, B., et al. 2009, ApJ, 695, 1058 [Google Scholar]
- Sánchez-Blázquez, P., Jablonka, P., Noll, S., et al. 2009, A&A, 499, 47 [Google Scholar]
- Sandage, A. 1986, A&A, 161, 89 [NASA ADS] [Google Scholar]
- Saracco, P., La Barbera, F., De Propris, R., et al. 2023, MNRAS, 520, 3027 [NASA ADS] [CrossRef] [Google Scholar]
- Schiavon, R. P., Faber, S. M., Konidaris, N., et al. 2006, ApJ, 651, L93 [Google Scholar]
- Scholz-Díaz, L., Martín-Navarro, I., & Falcón-Barroso, J. 2022, MNRAS, 511, 4900 [CrossRef] [Google Scholar]
- Scholz-Díaz, L., Martín-Navarro, I., Falcón-Barroso, J., Lyubenova, M., & van de Ven, G. 2024, Nat. Astron., 8, 648 [Google Scholar]
- Serra, P., & Trager, S. C. 2007, MNRAS, 374, 769 [Google Scholar]
- Slob, M., Kriek, M., Beverage, A. G., et al. 2024, ApJ, 973, 131 [Google Scholar]
- Spitoni, E., Vincenzo, F., & Matteucci, F. 2017, A&A, 599, A6 [NASA ADS] [CrossRef] [EDP Sciences] [Google Scholar]
- Thomas, D., Maraston, C., Bender, R., & Mens de Oliveira, C. 2005, ApJ, 621, 673 [Google Scholar]
- Toft, S., Gallazzi, A., Zirm, A., et al. 2012, ApJ, 754, 3 [NASA ADS] [CrossRef] [Google Scholar]
- Tomczak, A. R., Quadri, R. F., Tran, K.-V. H., et al. 2014, ApJ, 783, 85 [Google Scholar]
- Trager, S. C., Faber, S. M., Worthey, G., & González, J. J. 2000, AJ, 120, 165 [NASA ADS] [CrossRef] [Google Scholar]
- Trussler, J., Maiolino, R., Maraston, C., et al. 2020, MNRAS, 491, 5406 [Google Scholar]
- Trussler, J., Maiolino, R., Maraston, C., et al. 2021, MNRAS, 500, 4469 [Google Scholar]
- Valentino, F., Tanaka, M., Davidzon, I., et al. 2020, ApJ, 889, 93 [Google Scholar]
- Valentino, F., Brammer, G., Gould, K. M. L., et al. 2023, ApJ, 947, 20 [NASA ADS] [CrossRef] [Google Scholar]
- van der Wel, A., Bell, E. F., van den Bosch, F. C., Gallazzi, A., & Rix, H.-W. 2009, ApJ, 698, 1232 [NASA ADS] [CrossRef] [Google Scholar]
- van der Wel, A., Noeske, K., Bezanson, R., et al. 2016, ApJS, 223, 29 [Google Scholar]
- van der Wel, A., Bezanson, R., D’Eugenio, F., et al. 2021, ApJS, 256, 44 [NASA ADS] [CrossRef] [Google Scholar]
- van Houdt, J., van der Wel, A., Bezanson, R., et al. 2021, ApJ, 923, 11 [CrossRef] [Google Scholar]
- Vaughan, S. P., Barone, T. M., Croom, S. M., et al. 2022, MNRAS, 516, 2971 [CrossRef] [Google Scholar]
- Wake, D. A., van Dokkum, P. G., & Franx, M. 2012, ApJ, 751, L44 [NASA ADS] [CrossRef] [Google Scholar]
- Weibel, A., de Graaff, A., Setton, D. J., et al. 2025, ApJ, 983, 11 [Google Scholar]
- Whitaker, K. E., Franx, M., Leja, J., et al. 2014, ApJ, 795, 104 [NASA ADS] [CrossRef] [Google Scholar]
- Whitaker, K. E., Pope, A., Cybulski, R., et al. 2017, ApJ, 850, 208 [NASA ADS] [CrossRef] [Google Scholar]
- Whitaker, K. E., van Dokkum, P. G., Brammer, G., et al. 2013, ApJ, 770, L39 [NASA ADS] [CrossRef] [Google Scholar]
- Worthey, G., Faber, S. M., & Gonzalez, J. J. 1992, ApJ, 398, 69 [Google Scholar]
- Zhuang, Y., Leaman, R., van de Ven, G., et al. 2019, MNRAS, 483, 1862 [NASA ADS] [CrossRef] [Google Scholar]
- Zibetti, S., & Gallazzi, A. R. 2022, MNRAS, 512, 1415 [NASA ADS] [CrossRef] [Google Scholar]
- Zibetti, S., Gallazzi, A. R., Ascasibar, Y., et al. 2017, MNRAS, 468, 1902 [NASA ADS] [Google Scholar]
- Zibetti, S., Rossi, E., & Gallazzi, A. R. 2024, MNRAS, 528, 2790 [NASA ADS] [CrossRef] [Google Scholar]
- Zibetti, S., Pratesi, J., Gallazzi, A. R., Mattolini, D., & Scholz-Díaz, L. 2026, A&A, 708, A13 [Google Scholar]
Throughout the paper, to fit parametric relations we use the MPFIT IDL routine which finds the bestfit parameters of the supplied function by minimising the sum of the weighted squared differences between the model and data.
We use the CAP_LOESS_2D routine of Cappellari et al. (2013), which implements the multivariate LOESS algorithm of Cleveland & Devlin (1988), assuming a degree 1 approximation with frac = 0.3.
For galaxies with duplicate observations, redshift and velocity dispersion are the weighted mean of all the observations.
An even larger difference of 6 Gyr would be expected in the light-weighted age for the passive evolution of composite stellar populations (Gallazzi et al. 2014).
As shown in Curti et al. (2020), in the mass range log M* = 10.2 − 10.8 and for galaxies on or above the MS, the gas-phase metallicity decreases by 0.3 dex for a 1.5 dex increase in SSFR at fixed mass.
Appendix A: Robustness of quiescent and star-forming trends against different SFR and stellar population parameter estimates
Here we address how much the comparison between quiescent and star-forming galaxies and the dependence on SSFR are robust against: i) the classification criterion between Q and SF and the SFR indicator; ii) the stellar population parameters estimates.
In Fig. 1 we compare how a classification into Q/SF galaxies based on the SSFR (our choice) differ from one based on the U − V, V − J colours. We notice that these classifications are to a large extent consistent, with large overlap in the respective Q/SF samples. A classification based on UVJ, however, results in a larger sample of Q galaxies (Table A.1), thus including galaxies with SSFR closer to the MS. Our default selection based on SSFR is instead more conservative, classifying as quiescent the reddest galaxies in the UVJ quiescent zone.
Number of quiescent and star-forming galaxies classified with different criteria.
As default, we use SFR estimated from the UV and 24μm luminosities following Whitaker et al. (2014) and Bell et al. (2005) (SFRUVIR). In principle, the UV and IR (from monochromatic 24μm flux) luminosities trace the luminosity of young stars (direct or re-emitted by dust) and are thus good tracers of the star formation rate over timescales of ≲100 Myr (Kennicutt 1998; Bell et al. 2005, 2007). They were calibrated with the standard assumption of constant SFR in the past 100 Myr and might be biased, however, especially for low SFRs, because of contribution to the 24μm flux from dust heated by processes not associated with star formation, such as old stars and/or AGN. On the other hand, SFR estimates based on SED fitting naturally account for the variety and complexity of SFHs and hence for different contributions from old stars, but inherit biases associated with degeneracies in the SFH and dust parameters (see discussion in Leja et al. 2022). For these reasons, we checked how much a criterion based on SSFR is sensitive to the adopted estimates of SFR. In particular, we considered other SFR estimates obtained from SED or spectral fitting with Prospector as in Nersesian et al. (2025): i) instantaneous SFR from a fit to photometry only (SSFRProsp); ii) instantaneous SFR from a fit to spectroscopy plus photometry (SSFRProsp, s); iii) SFR averaged over the last 100 Myr from a fit to spectroscopy plus photometry ( ). We find a general agreement between SFRUVIR and any of SFRProsp, SFRProsp, s,
  for highly star-forming (or UVJ-selected SF galaxies), with a scatter of 0.35, 0.6, 0.5 dex, respectively, although with a systematic offset of 0.3, 0.6, 0.5 dex towards higher SFRUVIR with respect to the other estimates. Quiescent galaxies deviate to lower Prospector SFR estimates, with a scatter of 0.5-0.8 dex and systematic deviations ranging from 0.8 to 1.5 dex moving to lower-SFR galaxies. The slope and scatter of the relation between SSFR and M*, as well as the spread in SFR of galaxies below the MS, are sensitive to the adopted SFR estimates, as illustrated in Fig. A.1. Nevertheless, UVJ-classified Q and SF galaxies separate well in SSFR−M* for each of these SFR estimates. We consider all the LEGA-C galaxies within the redshift range of our silver sample and, for each SFR indicator, we fit a linear relation between SSFR and M* to the UVJ-classified star-forming galaxies. We then define those galaxies lying more than 2σ below the MS as quiescent (as indicated by the dashed and solid green line in each panel of Fig. A.1). This criterion identifies well the position where the quiescent and star-forming distributions cross for each SFR indicator, and results in consistent sample selection regardless of the SFR estimates adopted. In Table A.1 we compare the selection based on our default choice of SFRUVIR with each of the other SFR estimates, as well as with the UVJ classification. For each pair, we report the number of galaxies that are classified as Q/SF by both methods and those with mismatched classifications. There is in general a ∼90% agreement and a ∼10% contamination. We note that the UVJ classification of Q galaxies includes low-SFR galaxies. We have checked that results in Fig. 2 and 4 are not affected by differences in individual SFR estimates, as expected from the general good agreement on the Q/SF classification.
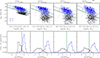 |
Fig. A.1. Comparison of Q/SF selection based on different SFR indicators. Galaxies are classified as Q if they lie 2σ below the SSFR−M* relation defined by UVJ-selected SF galaxies (blue points). The upper panels display the SSFR−M* relation for different SFR estimates: our default choice based on UV+24μm (SFRUVIR), estimate from Prospector fit to photometric data (SFRProsp), from Prospector fit to spectrum+photometry instantaneous (SFRProsp,s) or averaged over 100 Myr ( |

The secondary dependence of stellar metallicity on SSFR at fixed mass (Fig. 3) is also confirmed with any of the SFR estimates considered here, although with different significance. Figure A.2 compares the relations obtained with SFR estimates from spectroscopy+photometry Prospector fits, instantaneous (left) or averaged over the past 100 Myr (right). Results based on Prospector photometry-only fits are similar to the left panels. We consistently find that: i) galaxies with low stellar metallicity (log〈Z*/Z⊙〉 < −0.5) have the highest SSFR; ii) galaxies with low SSFR (i.e. below the MS) have all supersolar metallicity and a shallow relation with mass; iii) above 1011 M⊙ we see no systematic dependence on SSFR; iv) below 1011 M⊙ galaxies with higher SSFR are spread over a larger range in stellar metallicity (with increased downward scatter) than galaxies with lower SSFR. The choice of the SFR estimate affects the strength of a continuous relation between Z* and SSFR at fixed stellar mass, however, and in particular, the Z* − M* relation, which shifts upwards for the highest  bin.
bin.
 |
Fig. A.2. Comparison of the relation between stellar metallicity and SSFR at fixed mass as obtained with different SFR estimates. The upper panels display the SSFR versus stellar mass and the binning into distance from the MS; the bottom panels display the stellar metallicity-mass relations for bins of distance from the MS, as in Fig. 3. These plots are based on SFR estimates from spectrum+photometry Prospector fit (Nersesian et al. 2025), instantaneous (left plot) or averaged over the previous 100 Myr (right plot). |
To test the impact of the spectral inference of physical parameters, we compare the median age and metallicity scaling relations for quiescent and star-forming galaxies derived in this work with BaStA with those we would obtain, for the same sample, using estimates from Prospector (Nersesian et al. 2025) and from Bagpipes (Kaushal et al. 2024) (see also Appendix E of Paper I). Prospector estimates from Nersesian et al. (2025) adopts Simple Stellar Populations constructed from FSPS with MILES stellar library and MIST isochrones, non-parametric SFHs and constant metallicity along the SFH (see their Table 1), while Bagpipes estimates from Kaushal et al. (2024) adopts the 2016 version of Bruzual & Charlot (2003) models with MILES stellar library, double power-law SFH and constant metallicity (see their Table 1). In Fig. A.3 we show that all three codes agree in finding two distinct age sequences for quiescent and star-forming galaxies, with relations generally consistent within 1-2σ (where σ is the error on the median from BaStA) among the three codes. We note though that Prospector assigns younger ages to low-mass star-forming galaxies with respect to BaStA and Bagpipes. The mass–metallicity relations also agree within 1σ: quiescent galaxies are more metal-rich than star-forming and follow a rather shallow relation with mass. Some differences are however noticeable: the difference between quiescent and star-forming galaxies is larger for Bagpipes; Prospector finds a flatter relation for star-forming galaxies and lower metallicities for quiescent galaxies with respect to the other estimates. Note that this is likely largely ascribed to the upper boundary at 0.2 ⋅ Z⊙ assumed in the Prospector run, following the conservative choice of safe parameter range by Leja et al. (2019). This comparison serves to give a quantification of the cumulative effect of different model choices and ingredients on the derived physical parameters and their scaling relations. We note that the Bagpipes and Prospector runs are optimised to retrieve SFHs and timescales, while our BaStA run, focusing on selected absorption features, is optimised for combined age and metallicity estimates. We thus consider the latter as reference metallicity estimates.
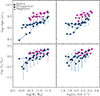 |
Fig. A.3. Median trends of light-weighted age (upper panels) and light-weighted stellar metallicity (lower panels) as a function of stellar mass (left) or velocity dispersion (right). The trends obtained with the BaStA estimates (this work, squares) are compared with those obtained with parameter estimates from Prospector (Nersesian et al. 2025, circles) and Bagpipes (Kaushal et al. 2024, stars). The galaxies are distinguished into quiescent (magenta) and star-forming (blue) with our default SSFRUVIR threshold. For clarity, the error bars show the 16th − 84th range of the distributions only for BaStA median trends. In this plot, metallicities have been scaled to a common solar scale of Z⊙ = 0.02. Comparison is done for golden sample. |
Appendix B: Median trends of age and stellar metallicity as a function of stellar mass and velocity dispersion
Here we provide tables with the median trends shown in Fig. 2 and 4. Table B.1 reports the median and percentiles of the distribution in light-weighted age and stellar metallicity as a function of stellar mass for quiescent and star-forming galaxies in the silver and golden samples (shown in Fig. 2). Table B.2 reports the median and percentiles of the distribution in light-weighted age and stellar metallicity as a function of velocity dispersion for quiescent and star-forming galaxies in the silver and golden samples (shown in Fig. 4).
Median trends of light-weighted age and stellar metallicity as a function of stellar mass as shown in Fig.2.
Median trends of light-weighted age and stellar metallicity as a function of velocity dispersion as shown in Fig.4.
All Tables
Fit to the median age and metallicity as a function of stellar mass for the general population.
Linear fit to the age and stellar metallicity as a function of velocity dispersion.
Number of quiescent and star-forming galaxies classified with different criteria.
Median trends of light-weighted age and stellar metallicity as a function of stellar mass as shown in Fig.2.
Median trends of light-weighted age and stellar metallicity as a function of velocity dispersion as shown in Fig.4.
All Figures
|
Fig. 1. Distribution in U − V vs. V − J (left panel) and SSFR vs. M* (right panel) for the parent LEGA-C sample (small dots) and for the silver (empty symbols) and high-S/N golden samples (filled symbols). In the left panel, galaxies are distinguished into Q (magenta) and SF (blue) based on their distance from the star-forming MS, our default classification (i.e. Q galaxies lie below the dashed line in the right panel). In the right panel, red/blue symbols identify Q/SF galaxies according to their location in the UVJ plane (left and right of the dashed line in the right panel, respectively). |
| In the text | |
|
Fig. 2. Luminosity-weighted mean age (left panels) and mean stellar metallicity (right panels) as a function of stellar mass and of SSFR for LEGA-C galaxies at z ≈ 0.7. Upper panels: Data points colour-coded by SSFR after applying LOESS-smoothing. The black vectors in the lower right corner are proportional to the partial correlation coefficients computed as in Scholz-Díaz et al. (2024), and the red vector indicates the direction of maximal increase of SSFR. The grey vectors correspond to a reference correlation coefficient of 0.7. Middle panels: Q galaxies (circles) and SF galaxies (stars), colour-coded by their SSFR, without smoothing. The filled symbols highlight galaxies in the golden subsample. The filled squares show the median age and median metallicity in bins of stellar mass 0.2 dex wide and with at least 5 galaxies (grey for the weighted silver sample, black for the non-weighted golden galaxies). The error bars indicate the 16–84 percentile range of each distribution (errors on the median are smaller). The median age-mass trends are fit with a linear relation (Eq. (2)), while the median metallicity–mass trends are fit with the functional form as in Eq. (3). The solid grey lines show the fit to the silver median relations, with extrapolation shown by the dashed lines. Bottom panels: Direct comparison of the volume and completeness-weighted median relations for Q (magenta) and SF (blue) galaxies in the silver sample. |
| In the text | |
|
Fig. 3. Top panel: SSFR vs. stellar mass for silver galaxies, divided into bins of distance from the relation fit to UVJ star-forming galaxies (dashed line, Eq. (1)). Bottom panel: luminosity-weighted mean stellar metallicity as a function of stellar mass for LEGA-C silver sample (grey points). The filled squares show the median stellar metallicity in bins of stellar mass (0.3 dex wide and with at least 5 galaxies), weighted by Tcor × w_spec_silver, for galaxies in different bins of distance from the MS (as illustrated in the top panel). The error bars represent the weighted 16th and 84th percentiles. The unweighted median trends would be very similar to those shown here, but with narrower inter-percentile ranges, in particular for the intermediate-SSFR sub-sample. |
| In the text | |
|
Fig. 4. Luminosity-weighted mean age (left panels) and mean stellar metallicity (right panels) as a function of stellar velocity dispersion for LEGA-C silver galaxies. Upper panels: Data points colour-coded by their SSFR after applying LOESS-smoothing. The black vectors in the bottom-right corner are proportional to the partial correlation coefficients computed as in Scholz-Díaz et al. (2024), and the red vector indicates the direction of maximal increase of SSFR. The grey vectors indicate a reference correlation coefficient of 0.7. Middle panels: Q galaxies (circles) and SF galaxies (stars), colour-coded by their individual SSFR. The filled symbols highlight galaxies in the golden subsample. The median trends in bins of σ* (0.1 dex wide and with at least 5 galaxies) are shown by grey (black) squares for the weighted silver (non weighted golden) sample. The linear fits to the median silver points are shown by solid lines (dashed lines for the extrapolation outside the median data points). Bottom panels: comparison of the median trends for Q (magenta) and SF galaxies (blue) in the silver sample. The error bars represent the 16–84 percentile range of each distribution. |
| In the text | |
|
Fig. 5. Comparison of the light-weighted age vs. stellar mass relation for LEGA-C and SDSS galaxy samples for the whole population (left panels) and for Q and SF galaxies separately (middle and right panels, respectively). The SDSS data include corrections for aperture effects, as well as weights for spectroscopic and volume completeness (see text for details). Top row: Data points show LEGA-C golden (filled black and dark points) and silver samples (filled grey and light points). The contours show the distribution for SDSS DR7 S/N > 10 samples, tracing number density levels that enclose 16, 50, 84, 97.5, 99.8, 99.9% of the total density. Middle row: median values of light-weighted age in bins of stellar mass for LEGA-C golden and silver sample (weighted for volume and spectroscopic completeness) and for SDSS, with the same colour-coding as in the top row. The error bars indicate the (weighted) 16–84 percentiles of the distribution. The solid curves show the fit to the median silver points, with the same functional form adopted in Paper I for the whole population (as Eq. (3) for metallicity) and with a linear function (Eq. (2)) for Q and SF galaxies. The dashed lines show the extrapolation beyond the range of the data. Bottom row: Difference in (linear) age between SDSS median points and LEGA-C (golden and silver) median points, with error bars computed from the error on the medians; the solid lines show the differences between the fitted functions in the middle row. The y-axis range extends to 5 Gyr, which corresponds to the cosmic time elapsed between z = 0.7 and z = 0.1, i.e. roughly the expected age difference under pure passive evolution. |
| In the text | |
|
Fig. 6. Difference in median light-weighted age (left panel) and median stellar metallicity (right panel) as a function of stellar mass between quiescent and star-forming galaxies at different redshifts. We compare Q and SF galaxies in LEGA-C (black circles) and in SDSS (green circles), as well as SF galaxies in LEGA-C with Q galaxies in SDSS, their potential descendants (orange stars). |
| In the text | |
|
Fig. 7. Comparison of the light-weighted stellar metallicity vs. stellar mass relation for LEGA-C and SDSS galaxy samples for the whole population (left panels) and for Q and SF galaxies separately (middle and right panels, respectively). Symbols, colours, and contours have the same meaning as in Fig. 5. The SDSS sample is restricted to S/N > 20 galaxies, weights are applied to correct for volume and spectroscopic completeness and the data are corrected for aperture effects. The bottom row shows the difference in (log) stellar metallicity between SDSS and LEGA-C median trends with error bars computed propagating the error on the medians. The dashed line at a difference equal to zero is drawn to guide the eye. |
| In the text | |
|
Fig. A.1. Comparison of Q/SF selection based on different SFR indicators. Galaxies are classified as Q if they lie 2σ below the SSFR−M* relation defined by UVJ-selected SF galaxies (blue points). The upper panels display the SSFR−M* relation for different SFR estimates: our default choice based on UV+24μm (SFRUVIR), estimate from Prospector fit to photometric data (SFRProsp), from Prospector fit to spectrum+photometry instantaneous (SFRProsp,s) or averaged over 100 Myr ( |
| In the text | |
|
Fig. A.2. Comparison of the relation between stellar metallicity and SSFR at fixed mass as obtained with different SFR estimates. The upper panels display the SSFR versus stellar mass and the binning into distance from the MS; the bottom panels display the stellar metallicity-mass relations for bins of distance from the MS, as in Fig. 3. These plots are based on SFR estimates from spectrum+photometry Prospector fit (Nersesian et al. 2025), instantaneous (left plot) or averaged over the previous 100 Myr (right plot). |
| In the text | |
|
Fig. A.3. Median trends of light-weighted age (upper panels) and light-weighted stellar metallicity (lower panels) as a function of stellar mass (left) or velocity dispersion (right). The trends obtained with the BaStA estimates (this work, squares) are compared with those obtained with parameter estimates from Prospector (Nersesian et al. 2025, circles) and Bagpipes (Kaushal et al. 2024, stars). The galaxies are distinguished into quiescent (magenta) and star-forming (blue) with our default SSFRUVIR threshold. For clarity, the error bars show the 16th − 84th range of the distributions only for BaStA median trends. In this plot, metallicities have been scaled to a common solar scale of Z⊙ = 0.02. Comparison is done for golden sample. |
| In the text | |
Current usage metrics show cumulative count of Article Views (full-text article views including HTML views, PDF and ePub downloads, according to the available data) and Abstracts Views on Vision4Press platform.
Data correspond to usage on the plateform after 2015. The current usage metrics is available 48-96 hours after online publication and is updated daily on week days.
Initial download of the metrics may take a while.