| Issue |
A&A
Volume 708, April 2026
|
|
|---|---|---|
| Article Number | A289 | |
| Number of page(s) | 26 | |
| Section | Extragalactic astronomy | |
| DOI | https://doi.org/10.1051/0004-6361/202554922 | |
| Published online | 14 April 2026 | |
LEGA-C stellar population scaling relations
I. Chemo-archaeological downsizing trends at z ∼ 0.7
1
INAF-Osservatorio Astrofisico di Arcetri, Largo Enrico Fermi 5, 50126, Firenze, Italy
2
Sterrenkundig Observatorium Universiteit Gent, Krijgslaan 281 S9, B-9000, Gent, Belgium
3
STAR Institute, Université de Liège, Quartier Agora, Allée du Six Aout 19c, B-4000, Liege, Belgium
4
Department of Physics and Astronomy and PITT PACC, University of Pittsburgh, Pittsburgh, PA, 15260, USA
5
Kavli Institute for Cosmology, University of Cambridge, Madingley Road, Cambridge, CB3 0HA, UK
6
Cavendish Laboratory – Astrophysics Group, University of Cambridge, 19 JJ Thomson Avenue, Cambridge, CB3 0HE, UK
7
Department of Astronomy, University of Michigan, 1085 South University Avenue, Ann Arbor, MI, 48109, USA
8
Department of Astronomy and Astrophysics, 525 Davey Lab, The Pennsylvania State University, University Park, PA, 16802, USA
9
Institute for Gravitation and the Cosmos, The Pennsylvania State University, University Park, PA, 16802, USA
10
Institute for Computational and Data Sciences, The Pennsylvania State University, University Park, PA, 16802, USA
11
Graduate Institute of Astrophysics, National Taiwan University, Taipei, 10617, Taiwan
12
Department of Physics and Center for Theoretical Physics, National Taiwan University, Taipei, 10617, Taiwan
13
Physics Division, National Center for Theoretical Sciences, Taipei, 10617, Taiwan
14
Space Telescope Science Institute, 3700 San Martin Drive, Baltimore, MD, 21218, USA
15
Department of Astronomy, University of Wisconsin-Madison, 475 N. Charter St., Madison, WI, 53706, USA
16
Dipartimento di Fisica, Università di Trento, Via Sommarive 14, I-38123, Povo, (TN), Italy
★ Corresponding author: This email address is being protected from spambots. You need JavaScript enabled to view it.
Received:
1
April
2025
Accepted:
18
January
2026
Abstract
We analysed the stellar population properties of a well-defined sample of 552 galaxies at redshift 0.6 < z < 0.77 drawn from the LEGA-C spectroscopic survey. This paper is the first of a series, and it is aimed at (i) presenting the catalogue of revised absorption indices for LEGA-C DR3 and of the inferred physical parameter estimates while describing their systematic uncertainties and at (ii) deriving benchmark scaling relations for the general massive galaxy population at intermediate redshift. We estimated light-weighted mean ages and stellar metallicities through careful analysis of key absorption features in the stellar continuum spectra of the galaxies coupled with photometry. The observables were interpreted in a Bayesian framework with a comprehensive library of model spectra based on stochastic star formation histories, chemical enrichment histories, and dust attenuations. We discuss various sources of systematic uncertainties within our method as well as systematic differences with results from other spectral fitting approaches. We derived volume-weighted scaling relations connecting light-weighted mean ages and stellar metallicities with galaxy stellar mass for the general galaxy population at ⟨z⟩ = 0.7 and masses > 1010 M⊙. We find the downsizing trends observed in the local Universe to be already in place 6 Gyr ago. We also observe a bimodal distribution of light-weighted ages as a function of mass, transitioning around 1011 M⊙. Such a bimodality is not observed in the stellar metallicity-mass relation, which changes from a steep to a flat regime across M* ∼ 1010.8 M⊙. Similar trends in age and metallicity also emerge as a function of velocity dispersion, but with a sharper transition from young to old around log σ* = 2.3. Differences with respect to the trends as a function of stellar mass suggest that age is primarily dependent on velocity dispersion below and above the transition regime, while both the stellar mass and the depth of the total gravitational potential well (as traced by the velocity dispersion) contribute to stellar metallicity. We release the catalogues of revised absorption index measurements for LEGA-C DR3 used in this work and of the inferred stellar population physical parameters to public repositories.
Key words: galaxies: abundances / galaxies: evolution / galaxies: fundamental parameters / galaxies: high-redshift / galaxies: stellar content
© The Authors 2026
 Open Access article, published by EDP Sciences, under the terms of the Creative Commons Attribution License (https://creativecommons.org/licenses/by/4.0), which permits unrestricted use, distribution, and reproduction in any medium, provided the original work is properly cited.
This article is published in open access under the Subscribe to Open model. This email address is being protected from spambots. You need JavaScript enabled to view it. to support open access publication.
1. Introduction
Galaxy evolution is governed by a complex and non-linear interplay between assembly processes, regulated by the matter distribution in the Universe, and baryonic processes, regulated by star formation and feedback and the matter cycle within galaxies (Somerville & Davé 2015). Despite the wealth and complexity of these processes and their interaction, present-day galaxies are observed to follow several scaling relations that connect the physical properties of their stellar and gaseous components to global properties such as their total mass, their size, and structure (e.g. Kauffmann et al. 2003a; Shen et al. 2003; Tremonti et al. 2004; Bernardi et al. 2005; Gallazzi et al. 2005; Cappellari et al. 2006; Saintonge et al. 2011; McDermid et al. 2015; Catinella et al. 2018). In particular, among these relations, the ones involving the age and chemical composition of stellar populations in galaxies serve as fossil records of the past star formation and chemical enrichment histories of galaxies that reach different final masses. It has long been established that the stellar populations in present-day passive galaxies are older, more metal rich, and more α enhanced in more massive systems than in their less massive brethren (e.g. Trager et al. 2000; Thomas et al. 2005; Gallazzi et al. 2006; Renzini 2006; Graves et al. 2009). These trends are referred to as an archaeological manifestation of star formation downsizing (Fontanot et al. 2009; Cowie et al. 1996), showing that star formation and metal enrichment were more efficient in the past for more massive galaxies. These relations extend to star-forming galaxies (Gallazzi et al. 2005; Panter et al. 2008; Zahid et al. 2017; Trussler et al. 2020), which generally show properties similar to passive galaxies in the high-mass regime but increasingly deviate from the passive trends towards lower masses. The transition from the passive to the star-forming regime in the scaling relations is suggested to be associated with a mass scale where the gas accretion mode and the dominant quenching mechanism change (e.g. Dekel & Birnboim 2006). While stellar population properties are observed to scale to the first order with galaxy mass (with a debate on whether it is the stellar or the dynamical mass that is the more relevant quantity), other parameters are observed to contribute to the scatter in the scaling relations, such as the current star formation activity (e.g. Looser et al. 2024), size and structure (Cappellari et al. 2006; McDermid et al. 2015), the galaxy hierarchy (e.g. Pasquali et al. 2010; Trussler et al. 2020; Gallazzi et al. 2021), and the host halo mass and environment (Baldry et al. 2006; Thomas et al. 2010; Pasquali et al. 2009; Scholz-Díaz et al. 2022; Oyarzún et al. 2022).
Scaling relations are important benchmarks for hydrodynamical simulations in the cosmological context, semi-analytic models and empirical models. Different models and approaches adopt different implementations of astrophysical processes (star formation efficiency, the production and cycle of metals, stellar and supernova feedback, growth and evolution of super-massive black holes, and active galactic nuclei feedback, gas cycling within the interstellar medium and to/from the inter-galactic medium). These processes regulate the growth of galaxies and their chemical enrichment and the epoch and timescale of quenching, shaping the resulting distribution of galaxy populations in physical properties, hence their scaling relations.
The interpretation of the observed scaling relations in the local Universe is limited by the fact that these archaeological tracers tell us when the stellar populations were formed but not directly when they assembled. Hence, they are less sensitive to galaxy assembly histories. Moreover, scaling relations are not evolutionary tracks. Instead, they represent a snapshot in time of the population evolution. For these reasons, the archaeological approach and the direct look-back approach, tracing the cosmic evolution of star formation activity and galaxy number densities (Madau & Dickinson 2014), need to complement each other by tracing the evolution of scaling relations (e.g. Lilly et al. 2013; Chen et al. 2020). The way forward is to apply the archaeological approach at different cosmic epochs to constrain galaxy star formation and assembly histories and connect progenitors and descendants in a statistical sense.
Because of the time variation of spectral diagnostics, moving to higher redshifts (hence to younger cosmic ages) presents the advantage of allowing the early phases of galaxy formation to be better resolved, which are very challenging to disentangle in the old populations of present-day galaxies. Moreover, this enables us to catch galaxies at epochs that are progressively closer to their peak activity and subsequent quenching, as depicted by the cosmic star formation rate density (Madau & Dickinson 2014). However, studies of the stellar component in higher-redshift galaxies have lagged behind studies of the ionised gas component (e.g. Erb et al. 2006; Maiolino et al. 2008; Moustakas et al. 2011; Zahid et al. 2013) because they require deep observations to reach a sufficient signal-to-noise ratio (S/N) in the stellar continuum sampling the rest-frame optical, thus moving into the observed near-IR (NIR). It is important to fill this gap and complement information on the metallicity of the interstellar medium (ISM) with that on the chemical composition of stellar populations, as it can give constraints on the mechanisms that regulate the baryon and metal cycle in galaxies (e.g. Garcia et al. 2024; Stanton et al. 2024).
The potential of applying the archaeological approach at earlier cosmic times has been shown by a number of pioneering studies at intermediate and high redshift. Until about a decade ago, studies of stellar ages and chemical composition from the rest-frame optical were limited to a few tens of galaxies or co-added spectra up to z ∼ 0.8. Most of these studies targeted red quiescent galaxies in clusters (Jørgensen et al. 2005; Sánchez-Blázquez et al. 2009; Jorgensen & Chiboucas 2013) or in the field (Schiavon et al. 2006; Ferreras et al. 2009; Choi et al. 2014; Leethochawalit et al. 2019), with the exception of Gallazzi et al. (2014) (hereafter G14) in which we analysed a mass-selected sample of ∼70 galaxies, including both quiescent and star forming.
At a higher redshift, z > 1 − 3, the stellar metallicities of limited samples of the brightest objects or of co-added spectra were studied from rest-frame UV absorption features (Rix et al. 2004; Halliday et al. 2008; Sommariva et al. 2012; Cullen et al. 2019) sampling the younger stellar component. To sample the bulk mass in the rest-frame optical, deep medium-resolution NIR spectroscopic data have been obtained for a few galaxies from the ground (Toft et al. 2012; Stockmann et al. 2020; Onodera et al. 2015; Lonoce et al. 2015; Kriek et al. 2019; Saracco et al. 2020; Carnall et al. 2022) and from space (Beverage et al. 2025; Carnall et al. 2024), and low-resolution slitless spectroscopy for relatively larger samples (Ferreras et al. 2019; Estrada-Carpenter et al. 2019).
Currently, the highest redshift available for the necessary deep stellar continuum spectroscopy for large and representative samples of galaxies is 0.6 < z < 1, with the ∼200 night Large Early Galaxy Astrophysics Census (LEGA-C) VIMOS/VLT survey (van der Wel et al. 2016; Straatman et al. 2018; van der Wel et al. 2021), which provides spectra of the required stellar continuum quality and for near-mass-selected samples at intermediate redshifts (0.6 < z < 1). The deep 20-h observations of LEGA-C spectra allow for robust measurement and fitting of rest-frame optical absorption features, enabling the analysis of ages, metallicities, and star formation histories (SFHs; Chauke et al. 2018, 2019; Wu et al. 2018a,b; D’Eugenio et al. 2020; Barone et al. 2022; Woodrum et al. 2022; Cappellari 2023; Beverage et al. 2023; Kaushal et al. 2024; Nersesian et al. 2025) as well as stellar kinematics (Bezanson et al. 2018; de Graaff et al. 2021; D’Eugenio et al. 2023a; D’Eugenio et al. 2023b) and dynamical modelling (van Houdt et al. 2021; van der Wel et al. 2022).
In this work we leverage the high spectral quality, large statistics, and well-defined target selection of LEGA-C to characterise the volume-weighted distributions of light-weighted mean ages and stellar metallicities as a function of stellar mass and velocity dispersion for massive galaxies at 0.6 < z < 0.77. We rely on optimally selected key stellar absorption features sensitive to age and total metallicity in combination with rest-frame optical photometry. These diagnostics are interpreted with our Bayesian stellar population analysis (BaStA) framework through comparison with a Monte Carlo library of model spectra encompassing a range of SFHs, chemical enrichment histories, and dust attenuations (Gallazzi et al. 2005; Zibetti et al. 2017; Zibetti & Gallazzi 2022). This approach is complementary to full spectral fitting methods in that it focuses on selected, well-understood spectral features that are chiefly sensitive to age and metallicity (Worthey et al. 1994; Worthey & Ottaviani 1997; Vazdekis & Arimoto 1999; Thomas et al. 2004). Moreover, thanks to the direct and full sampling of the prior as determined by the pre-computed model library, the resulting posterior provides uncertainties that fully capture the underlying degeneracies.
Our sample of ∼550 galaxies, carefully selected to have reliable measurements of stellar absorption features that were used as constraints to age and metallicity, is representative of the whole galaxy population down to 1010.4 M⊙ and of the star-forming population down to 1010 M⊙. With this sample we explore the stellar population properties of massive galaxies at ⟨z⟩ = 0.7 and how their scaling as a function of stellar mass or stellar velocity dispersion differs.
In the second paper of this series (Gallazzi et al. 2026, hereafter Paper II), we further explore how the z = 0.7 global age and stellar metallicity scaling relations differ between quiescent and star-forming galaxies and to what extent the stellar metallicity, averaged over the SFH, is sensitive to ongoing star formation activity. We then combine our LEGA-C results with a consistent analysis, in terms of observational constraints and modelling assumptions, of a volume- and completeness-corrected sample of galaxies from the Sloan Digital Sky Survey Data Release 7 (SDSS DR7) presented in Mattolini et al. (2025) to quantify the evolution of the scaling relations between z = 0.7 and z = 0.1.
As a product of the work presented here, we provide two catalogues with revised absorption index measurements for the whole LEGA-C third data release (DR3): one with measurements derived from individual spectra and one with measurements obtained by combining duplicate observations when available. We also provide the catalogue of the inferred stellar population physical properties for the full LEGA-C DR3 sample. The catalogue includes the stellar population properties (mean ages, stellar metallicities, stellar mass, and dust attenuation) derived in this work with BaStA based on duplicate-combined index measurements for the whole DR3, as well as those derived with independent spectral fitting analysis performed within the LEGA-C team, specifically from spectrum plus photometry fits with Prospector presented in Nersesian et al. (2025) and with BAGPIPES presented in Kaushal et al. (2024).
The paper is organised as follows. In Sect. 2 we describe the LEGA-C spectroscopic data used in this work, the measurement of stellar absorption features, and the galaxy sample analysed along with sample statistical corrections. In Sect. 3 we introduce our BaStA stellar population fitting approach building on Gallazzi et al. (2005) and Zibetti et al. (2017), and we describe the adopted model library together with the spectroscopic and photometric constraints used. The resulting stellar population physical parameter estimates and uncertainties are presented in Sect. 4. Our main results on the stellar population scaling relations in LEGA-C are presented in Sect. 5, where we characterise the volume-weighted relations for the global massive galaxy population, connecting light-weighted ages and stellar metallicity to stellar mass and velocity dispersion. We discuss the observed downsizing trends in Sect. 6 and summarise our results in Sect. 7.
For the interested readers, we provide more technical details in the Appendices, including the revised catalogue of absorption indices (Appendix A) and the treatment of LEGA-C duplicate observations (Appendix B); an assessment of the impact of dust modelling on the age and metallicity inference (Appendix C); an assessment of the impact of modelling assumptions within our method in comparison to our previous work (Appendix D); and a comparison with parameters estimated from Prospector and BAGPIPES, which were respectively presented in Nersesian et al. (2025) and Kaushal et al. (2024), and from pPXF, presented in Cappellari (2023) (Appendix E).
Throughout the paper we assume a ΛCDM cosmology with H0 = 70 km/s/Mpc, ΩM = 0.3, and ΩΛ = 0.7. We also assume a solar stellar metallicity of Z⊙ = 0.0154, and we adopted a Chabrier (2003) Initial Mass Function (IMF).
2. Data and sample
2.1. The LEGA-C data
The LEGA-C survey has obtained deep spectra for a total sample of 4081 galaxies, 3029 of which are primary targets selected from the UltraVISTA catalogue (Muzzin et al. 2013a) with redshift 0.6 < z < 1 and KS magnitude brighter than KS, lim = 20.7 − 7.5log((1 + z)/1.8). Observations were conducted with the VIMOS spectrograph on VLT, integrating ∼20 h on source, with an effective spectral resolution of R ∼ 3500 over the observed wavelength range 6300 < λ < 8800 Å. Details on the survey goals and design, and the observational set-up are extensively presented in van der Wel et al. (2016) and Straatman et al. (2018).
In this work we use the 1-d spectra from the LEGA-C third data release (DR3). Details on the data reduction, spectra extraction and spectral measurements in DR3 can be found in van der Wel et al. (2021). The LEGA-C 8″ × 1″ slits typically encompass a representative fraction of the galaxy light. The 1-d spectra are obtained from optimal extraction using the HST-based Sersic light profile. In this work we are particularly interested in the metal-sensitive features around rest-frame 5000 Å, which for the LEGA-C galaxies fall in the > 7000 Å observer-frame range affected by telluric absorption. The revision of the telluric absorption correction devised for DR3 is thus of particular importance for the accuracy of our measurements. Spectrophotometric calibration has been obtained comparing the uncalibrated LEGA-C spectra with best-fitting templates from BVrizYJ SED fits.
2.2. Measurement of stellar absorption features
We measure stellar absorption features using the index definitions of the Lick system (Worthey et al. 1994), in addition to the 4000 Å-break D4000n (Balogh et al. 1999) and the high-order Balmer lines (Worthey & Ottaviani 1997). Note that indices are not translated to the Lick system, but are measured on the rest-frame observed spectra at their native resolution, thus including instrumental resolution and broadening due to the intrinsic velocity dispersion of the galaxy. The strength of stellar absorption indices is measured off of the rest-frame emission-line-subtracted spectra. As described in van der Wel et al. (2021), the decoupling of the stellar continuum from the emission lines is performed with a coordinated fit with pPXF (which provides a bestfit continuum consisting of a combination of MILES stellar spectra Falcón-Barroso et al. 2011, and 15th order multiplicative Legendre polynomial) and platefit (which determines emission line fluxes and EW from the continuum subtracted spectrum). Because in the index measurement pixels are assigned equal weight regardless of their noise, to avoid being strongly biased by high-noise wavelength elements, we flag pixels that deviate by more than 2σ (and with a minimum of 10%) from the bestfit pPXF continuum. This model only serves to identify highly deviant pixels but does not enter in the index measurement. The flagged pixels are linearly interpolated over. They are in total about 7% of all pixels used in the index measurement. Details on this procedure are described in van der Wel et al. (2021). We consider the index measurement reliable only if less than one-third of the pixels in any of the central or pseudo-continuum side bands are flagged. After the DR3 was released we discovered that a fraction of ∼15% of LEGA-C spectra did not receive a measurement of the absorption indices, despite the good quality of the spectrum and the lack of artefacts. This was tracked down to be related to a silent bug in the run of pPXF associated with the rebinning of the spectra. We thus re-processed the emission-line subtracted spectra for cleaning and index measurement. We then measure absorption indices with our routine BaStA_index.
Formal errors are estimated in first place via standard error propagation based on the noise spectrum. In a second step, based on repeated LEGA-C observations we estimate scaling factors to apply to these formal errors and obtain the actual errors adopted in the stellar population analysis. This factor is estimated to be 1.3 for all indices, except for D4000n (2) and Hβ (1.8) owing to larger uncertainties associated to spectro-photometric calibration and emission line infill, respectively (van der Wel et al. 2021). We release the revised catalogue of index measurements for the whole DR3 (see Appendix A), both for individual spectra and combining duplicate observations when available (see Sect. 2.3).
2.3. Spectroscopic requirements and samples definition
The sample used in this work to derive scaling relations comprises galaxies belonging to the primary sample (primary = 1), with no sign of active galactic nuclei (AGN) contamination in the LEGA-C spectra (flag_spec = 0), with a measurement of stellar velocity dispersion from the pPXF fit (sigma_star > 0) and spectroscopic redshift 0.55 < z_spec < 1.1. This represents a parent sample of 2864 spectra.
Some of the objects in the sample have duplicate observations. These are useful not only to assess more reliably the uncertainties on spectral measurements that are not captured by the sole noise spectrum but also could be used to increase the wavelength coverage for a given galaxy. Because of the different position of the slit on the mask in different observing runs, the actual observed wavelength range can vary between different observations of the same object. We take advantage of this to maximise the number of absorption features covered for each galaxy. For each object in the parent sample we check whether there are more than one usable observation (typically two or three). If so, for each absorption index we compute the error-weighted mean of the index measurements available for that objects. Objects with duplicate observations are thus included only once in our final, parent sample, using the duplicate-combined index measurements. After accounting for duplicate observations, the parent sample consists of 2588 unique galaxies. In Appendix B we assess the reliability and improved quality of the parameter estimates based on combined duplicate observations with respect to individual ones.
As described in Sect. 3.2, for our stellar population analysis we further require the measurement of at least one of the Balmer absorption indices (Hβ, HδA, HγA) and at least one of the composite metal-sensitive indices (among [MgFe]′, [Mg2Fe], [MgFe52]′, [MgFe50]′). After combining the measurements for duplicate observations, this requirement reduces the sample to 575 unique galaxies. The large reduction of the sample from 2588 to 575 unique galaxies mainly results from the wavelength coverage of the LEGA-C spectra which limits the observability of the Mg, Fe5270 and Fe5335 features up to z ∼ 0.77, and only a minor fraction of galaxies are excluded because of large spectroscopic uncertainties preventing an index measurement (as explained in the previous section). Considering only the sets of indices that we deem reliable for stellar population fitting (see Sect. 3), our analysis is finally reduced to a silver sample of 552 galaxies and a golden sub-sample of 323 galaxies with spectral S/N > 20/pixel1. The number of galaxies in each sub-sample are summarised in Table 2. We notice that if we did not combine duplicate observations, but simply took the observation with the highest S/N for each object with repeated observations, the silver (golden) samples would reduce to 491 (236) unique galaxies.
Our final sample spans a range in physical properties, in particular mass and star formation activity. Figure 1 shows the distribution in stellar mass versus redshift for the whole LEGA-C sample and for the sample analysed here. As already mentioned, the redshift limit z ≲ 0.77 is imposed by the wavelength coverage. Stellar mass extends over the range 1010 M⊙ ≲ M* ≲ 1011.5 M⊙. The requirement of S/N > 20 preferentially selects against lower mass galaxies (M* < 1011 M⊙). Figure 2 illustrates how our sample is representative of galaxies with different levels of current star formation, by showing the distribution in specific star formation rate versus stellar mass (SSFR–M*) and in U − V versus V − J (UVJ) diagrams. We define as quiescent (Q) those galaxies that lie more than 2σ below the Star Forming Main Sequence (SFMS; below the dashed line in the left-hand panel)2 and as star-forming (SF) galaxies consistent within 2σ with the SFMS (i.e. above the dashed line). Since our sample is selected in K band, the requirement of high S/N in the optical restframe (roughly corresponding to the R and I bands) disfavours the tail of the galaxy distribution with the reddest optical-NIR colours. As we can see from Fig. 2, this tail is largely composed of heavily dust-attenuated star-forming galaxies.
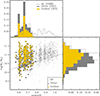 |
Fig. 1. Distribution in stellar mass and redshift for the LEGA-C primary sample (grey dots and dot-dashed histograms, normalised to unit integral) and for the sub-samples used in the analysis. The sub-samples are the silver sample (grey symbols and histograms) and the golden sample (golden symbols and histograms). The histograms for the silver and golden samples have been normalised by the number of galaxies in the silver sample. The number of galaxies in each sub-sample is given in parenthesis. Redshifts come from the LEGA-C DR3 catalogue, while stellar masses are those computed in this work. |
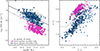 |
Fig. 2. Distribution in specific SFR versus stellar mass (left panel) and in U-V, V-J rest-frame colours (right panel). We separated the galaxies into quiescent (Q, magenta circles) and star-forming (SF, blue stars) based on their location with respect to the star forming main sequence (SFMS; solid line in the left panel). The Q galaxies are those deviating by more than 2σ below the SFMS (i.e. they lie below the dashed line in the left panel). The right-hand panel illustrates how this selection compares with the UVJ quiescent zone outlined by the dashed segment (Muzzin et al. 2013b). Empty (filled) symbols indicate galaxies in the silver (golden) samples. The numbers in the left panel give the number of SF and Q galaxies in the golden, silver and parent LEGA-C samples. All quantities in this plot come from the LEGA-C DR3 catalogue, except stellar masses which are those computed in this work. |
In this paper, we separate Q and SF galaxies in Sects. 3 and 4 in order to illustrate the quality of spectroscopic measurements for the two classes of objects, the different accuracy of parameter estimates and the different systematic uncertainties that pertain to Q and SF galaxy spectra. This is useful for anyone wishing to use our catalogue for different analysis. For convenience, we opt to use the definition of Q/SF that we adopt in Paper II where we analyse the scaling relations separately for the two classes of galaxies and their evolution with respect to local galaxies classified with an equivalent criterion.
2.4. Sample statistical corrections
Our sample is drawn from the Ks-band selected LEGA-C parent sample according to the availability of key spectral absorption features and to their spectral S/N. Therefore some statistical corrections are needed to compute volume-limited quantities accounting for incompleteness and selection bias. First, we consider (i) the volume correction factor Vcor which accounts for the fact that the LEGA-C sample is magnitude-limited, (ii) the completeness correction factor Scor which accounts for mass-dependent incompleteness in the observed sample with respect to the parent UltraVISTA sample (see van der Wel et al. 2021). The product of the two corrections is the Tcor parameter in the DR3 catalogue. The full LEGA-C sample is representative of the whole galaxy population at ⟨z⟩ = 0.7 down to log M*/M⊙ = 10.4. The completeness limit for blue galaxies only extends to masses 0.2 dex smaller.
We then quantify and correct for biases introduced by our sample selection for studying age and metallicity scaling relations. In particular, we wish to account for incompleteness as a function of stellar population properties at a given stellar mass. This is quantified by the fraction of galaxies that enter our sample definitions (specifically the silver and the golden samples which we use for the statistical analysis) with respect to the parent sample that would be available to us. As parent sample we consider the main LEGA-C sample (PRIMARY = 1, FLAG_SPEC = 0, SIGMA_STARS_PRIME > 0) restricted to the redshift range over which at least one of the metal-sensitive composite indices would be available (i.e. the redshift out to which Fe5335 would be observable, z < 0.79). We opt to measure incompleteness in a space of the observables that trace stellar population properties independently from our modelling, namely we consider the rest-frame U − V colour as proxy for stellar populations physical parameters and the absolute g-band luminosity Lg as proxy for galaxy stellar mass. For each galaxy in the silver (golden) sample we consider the 20 nearest neighbours in the (U − V)−Lg plane in the parent sample. The inverse of the fraction of silver (golden) galaxies among these 20 is then taken as the statistical weight w_spec_silver (w_spec_golden) to apply to correct for incompleteness. The weights w_spec_silver range from 1 to 5 quite uniformly over the colour-luminosity plane, with the tendency for bluer galaxies at fixed luminosity to have slightly larger weights. For the golden sample w_spec_golden range from 1 to 10 with a stronger gradient with stellar mass. Because of the larger variations and uncertainties in w_spec_golden due to smaller number statistics in the low-mass/low-luminosity regime, in the analysis presented in Sect. 5 we rely on the weighted silver sample as our reference for population statistical trends, while we use the unweighted golden sample as a control with higher-quality measurements.
3. Stellar population modelling
In order to estimate stellar population physical parameters, such as mean weighted ages and metallicities, in addition to stellar mass, we used our code BaStA (Zibetti & Gallazzi 2022) which adopts and builds upon the bayesian approach described in Gallazzi et al. (2005, 2014). The code compares a selected set of spectral diagnostics and photometric data to those predicted by a large library of model spectra constructed by convolving Simple Stellar Population (SSP) models with randomly generated SFHs, metallicity histories and dust attenuation parameters. The posterior probability distribution function (PDF) of selected physical parameters, marginalised over all the other parameters, is computed by weighing each model by the likelihood of the data for that model. We then take the median of the PDFs and half of the 84th − 16th percentile range as fiducial value of the parameter and its associated uncertainty, respectively. We stress that these uncertainties include not only the error associated to observational uncertainties, but also degeneracies within the assumed prior distribution of SFHs, metallicity and dust.
3.1. The library of spectral models
The model library used here is constructed following Zibetti et al. (2017) and Zibetti & Gallazzi (2022), and comprises 500000 models obtained by convolving SSP models with Monte Carlo SFHs. In this work we adopt the SSPs of the 2019 version of Bruzual & Charlot (2003) population synthesis code (CB19) which are based on the MILES stellar library (Falcón-Barroso et al. 2011) and on the Parsec evolutionary tracks (Chen et al. 2015). We adopted the Chabrier (2003) IMF. For a more detailed description of the ingredients adopted in CB19 we refer to Appendix A of Sánchez et al. (2022). Following Plat et al. (2019) and Gutkin et al. (2016) for the solar scale adopted in the Parsec evolutionary tracks, we normalise the stellar metallicities to the present-day photospheric solar metallicity of Z⊙ = 0.015243.
In our model library, the SFHs are described as the superposition of a smooth secular component and random bursts. The secular component is given in the form of a delayed Gaussian (Sandage 1986, also referred to as ‘a la Sandage’, see Gavazzi et al. 2002), which allows for both a rising and a declining phase. On top of this continuum SFH, bursts of star formation can occur in random number (up to six), age and intensity.
A major change compared to our previous works and others using pre-computed model libraries in a bayesian approach (e.g. Gallazzi et al. 2005, 2021; da Cunha et al. 2008) is the introduction of a chemical enrichment history (CEH) through a parametrization for the metallicity evolution along the SFH, rather than assuming a constant metallicity value. The chosen parametrization is reminiscent of a leaking box model (Erb 2008), having as parameters the initial and the final metallicity and a parameter describing the swiftness of enrichment. The metallicity increases with the stellar mass formed following this parametrization. Bursts are allowed to have a metallicity drawn from a Gaussian centred on the value of the secular metallicity at the same epoch, thus introducing some scatter in the metal enrichment history. Finally, the emergent spectra are attenuated according to a Charlot & Fall (2000) dust attenuation model separating the contribution from the birth clouds to that of the diffuse interstellar medium. A summary of the adopted priors is provided in Table 1 and a full description is provided in Appendix A of Mattolini et al. (2025). Notice that for each galaxy we then only consider models that have a formation age tform younger than the Universe age at the galaxy’s redshift (with an allowance of 0.2 dex).
Summary table of the parameters used to generate the composite stellar populations library.
Beside the parameters that generate the SFHs, CEHs, and dust attenuation (as summarised in Table 1), for each model spectrum we compute a number of derived parameters which describe in a non-parametric way the resulting properties averaged over the SFH, namely: (i) the r-band-weighted average age and stellar metallicity4, log⟨Age/yr⟩r and log⟨Z*/Z⊙⟩r; (ii) the mass-weighted average age and stellar metallicity, log⟨Age/yr⟩M and log⟨Z*/Z⊙⟩M; (iii) the total present-day stellar mass, log(M*/M⊙); (iv) the effective dust attenuation in the g-band, Ag. These are the parameters of which we are interested in deriving the posterior PDF for each galaxy, by marginalising over all the other model parameters.
3.2. Spectroscopic and photometric constraints
The observational constraints that we adopt combine a selected set of stellar absorption features with photometric data. All the results shown in the following are obtained fitting both spectroscopic and photometric data simultaneously. As stated in Sect. 2, the observed absorption indices are measured at the original spectral resolution (including instrumental and velocity dispersion broadening). For each galaxy, these are compared to indices measured on the model spectra convolved at the same effective resolution and broadening of the galaxy. The absorption features are chosen among those showing distinct sensitivity to age and metallicity, while having at the same time a negligible dependence on element abundance ratios, since our models are based on scaled-solar SSPs and do not allow for variable abundance ratios for individual elements. Building on our previous work (G05, G14), the ideal set of indices combines age-sensitive features such as D4000n, Hβ, HδA + HγA, with metal-sensitive features such as [Mg2Fe] (Bruzual & Charlot 2003), [MgFe]′ (Thomas et al. 2003). Because of the wavelength coverage of LEGA-C spectra, there are only 57 galaxies with this complete set of five indices. We consider other two combinations of Mg and bluer Fe features that show a negligible dependence on [α/Fe], namely [MgFe50]′ and [MgFe52]′ as defined in Kuntschner et al. (2010)5.
We thus considered the following sets of indices:
-
(s1)
any index available among D4000n, Hβ, HδA, HγA (or, preferred, HδA + HγA if both Balmer indices are available)
combined with the set s2a if possible or, alternatively, with set s2b, where:
-
(s2a)
[Mg2Fe] in combination with [MgFe]′ or [MgFe52]′ or alone,
-
(s2b)
[MgFe50]′ in combination with [MgFe]′ or [Mg2Fe] or [MgFe52]′ or alone.
Our minimum requirement for reliable age and metallicity estimates is to have at least one of the Balmer absorption lines and at least one of the Mg-Fe composite indices listed above. Galaxies meeting this requirement and that can be fit by one of the index sets above constitute our silver sample of 552 galaxies6.
The index sets listed above were chosen after checking that stellar population parameters inferred from different indices do not show a bias, with respect to the optimal set of five indices (D4000n, Hβ, HδA + HγA, [Mg2Fe], [MgFe]′). For this test, we considered the 52 galaxies for which all the age and metal-sensitive indices are available, and we fit them with all the different index combinations allowed. We then compare the resulting ages and metallicities with those obtained with the reference fit based on the optimal index set. We find that all the chosen index combinations with which LEGA-C galaxies are fit do not show systematic bias (within few hundredths of decimal exponent) with respect to the reference fit, with a scatter comparable or smaller than the mean parameter uncertainties. More than 40% of the silver sample is fit (in addition to s1) with both [MgFe]′ and [Mg2Fe], about 30% with [MgFe50]′, 10% with [MgFe50]′ and [MgFe52]′, 7% with [Mg2Fe] and [MgFe52]′, the other index combinations apply to a few percent each.
In Fig. 3 we show the distribution of LEGA-C galaxies in the index-index diagnostic diagrams combining the Balmer absorption lines with D4000n and with the red composite Mg-Fe indices. In each panel, dots display all LEGA-C galaxies for which the two indices are measured, while empty (filled) symbols indicate galaxies in the silver (golden) sample, distinguished into Q (magenta circles) and SF (blue stars). The coverage of the model library is shown by the coloured map, where the colour reflects the mean light-weighted age (left-most panels of Balmer lines versus D4000n) and the mean light-weighted stellar metallicity (right panels of Balmer lines versus Mg-Fe composite indices). This figure serves as an illustration of how the physical parameters map onto the observational diagnostics, but we remind that the fit is performed in the multi-dimensional space of indices and photometry. The figure shows that our model library provides an adequate coverage of the observational space of LEGA-C galaxies. In turn, we note that the LEGA-C sample analysed here spans a large range of physical parameters and underlying SFHs, spreading over a substantial fraction of the model parameter space. From Fig. 3 we see that most of the observations lie within the parameter space defined by our models, with a few exceptions due to large observational errors. To control for possible outliers, in the fit we discard an absorption index if its measurement lies more than 3σ away from the models (where σ is the observational error on the index). All the silver and golden data points shown in Fig. 3 indicate galaxies whose measurement is within 3σ of the model grid.
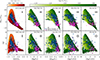 |
Fig. 3. Distribution in diagnostic diagrams of the absorption indices showing the combinations of indices considered in this work for their different sensitivity to age and metallicity. The coloured region shows the distribution of the adopted model library of complex star formation and metal enrichment histories (see Sect. 3.1), colour-coded for r-band light-weighted age (left-most panels) and for r-band light-weighted stellar metallicity. Symbols are as in Fig. 2: galaxies are distinguished into quiescent (magenta) and star-forming (blue) based on a mass-dependent threshold in specific SFR; empty symbols indicate galaxies belonging to the silver sample, i.e. with optimal combinations of indices, while filled symbols refer to the golden sub-sample (with S/N > 20); dots display all the galaxies in the LEGA-C sample with measurements of the two indices in each panel. In each panel only galaxies for which the corresponding couple of indices has been used in the fit are shown (therefore all the galaxies shown lie within 3σ of the model region). In each panel we report the number of galaxies shown among those in the full LEGA-C, silver or golden samples. The error bars display the median uncertainty on each index for the golden (thick black) and the silver galaxies (thin grey). |
Figures 4 and 5 show, for the indices used for stellar populations constraints, how well the observed index strengths are reproduced by the models. The left panels compare the observed index strength with the one predicted by the best-fit model (i.e. the model of minimum χ2 considering both absorption indices and photometry), both for the whole LEGA-C primary sample (grey circles) and for the silver, golden Q and golden SF samples used in this work (black, magenta, blue circles respectively). The right panels display the histograms of the difference between predicted and observed index strength normalised by the observational uncertainty. In all cases the agreement is very good and within the observational uncertainties. Nevertheless, we notice the tendency to underestimate D4000n and HδA + HγA and slightly overestimate Hβ for golden quiescent galaxies. We checked that the comparison between best-fit model and observations is slightly improved for the quiescent galaxies if we fit only absorption features (without photometry) to dust-poor models. This may signal some tension in the SPS models between different observational constraints (indices and photometry). As we discuss in Appendix C, we are overall confident that our treatment of dust, necessary for analysing the general galaxy population in a consistent way, does not introduce significant bias. It is worth noticing that a mismatch in D4000n–Hδ between LEGA-C and model predictions (IllustrisTNG) has been discussed in Wu et al. (2021), originating either from systematic uncertainties in SPS models or from the requirement of small recent bursts of star formation in otherwise old systems.
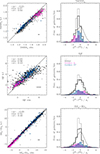 |
Fig. 4. Comparison between observed and best-fit predicted index strengths for the absorption features considered in the BaStA fit as age-sensitive diagnostics. Left panels: Best-fit versus observed index strength. Grey filled circles show the full primary LEGA-C catalogue for which the index is measured; black circles highlight galaxies in the silver sample; magenta (blue) circles highlight quiescent (star-forming) galaxies in the golden sample. Filled symbols indicate galaxies for which the index has been used in the fit. The thin and thick error bars indicate the median observational error for silver and golden galaxies respectively. The median offset, rms scatter and the median uncertainty are reported in each panel for the silver sample. Right panels: distribution of the difference between the absorption index strength predicted by the best-fit model and the observed one, normalised by the observational error (regardless of whether the index was used in the fit). Grey histograms are for the whole LEGA-C sample (normalised to unit area); black, magenta, blue histograms refer to the silver, golden Q, golden SF respectively (normalised to the silver sample). A Gaussian centred on zero and with unit standard deviation is shown for reference (dot-dashed curve). |
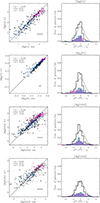 |
Fig. 5. Same as Fig. 4 but for the absorption features considered in the BaStA fit as metallicity-sensitive diagnostics. |
As mentioned, in addition to spectral absorption indices, we add constraints from the spectral shape in order to infer simultaneously stellar masses and dust attenuation together with age and metallicity. We extract the photometric information from the UltraVISTA catalogue of Muzzin et al. (2013a). We consider the fluxes in the photometric bands r, i, z, Y, J, which cover the reft-frame wavelength range between 3800 and 7500 Å at the mean redshift of our sample. Following the conclusions in Appendix B of van der Wel et al. (2021), we exclude photometric bands that sample redwards of the rest-frame 8000 Å. We also exclude from the fit the B and V bands which sample the near-UV spectral range, motivated by the fact that at the rest-frame UV wavelengths the CB19 models are less reliable, manifesting also as a mismatch between the observed colours and the model colours at fixed absorption indices. We performed several tests changing both the model library (the base SSPs and the recipes for composite stellar populations) and the observational constraints. We found that fits that included the B and V photometry provided parameter estimates that varied significantly changing e.g. the SPS models or the chemical evolution assumptions. This affected in particular massive quiescent galaxies that were assigned younger ages and higher dust attenuations, inconsistent with their J − 24 μm colours. Similarly as for the indices, we have checked that for magnitudes and colours in the bands used for the fit the mean deviation between observations and best-fit model is 0.1−0.2 times the observational uncertainty.
4. Estimates of stellar populations physical parameters
The stellar populations physical parameters that we are primarily interested in are the light-weighted mean age and the light-weighted mean stellar metallicity. In addition to these, we also consistently extract stellar mass and dust attenuation estimates. The stellar mass is the mass surviving in stars and remnants and is obtained for each model in the library as the normalisation factor that minimises the χ2 of the rizYJ photometry. The dust attenuation of each model is computed in the rest-frame g-band, directly comparing the broad-band flux of the attenuated model spectrum with that of the unattenuated model spectrum7. For each of these physical parameters we construct the posterior probability density function (PDF), marginalising over all the nuisance parameters, as described in Sect. 3. Table 2 reports the mean uncertainties in physical parameter estimates for the silver and golden sub-samples. In Appendix D we address systematic differences with respect to our previous modelling assumptions (Gallazzi et al. 2005, 2014), while in Appendix E we compare our estimates with those derived with BAGPIPES or Prospector in Kaushal et al. (2024) and Nersesian et al. (2025), respectively. Although the scientific results presented in this paper (Sects. 5 and 6) pertain to the general galaxy population, in this section and the Appendix we keep the separation between Q and SF galaxies in order to present the typical accuracy in parameter estimates that can be achieved for the two classes of objects. This is relevant because the ability to constrain ages and metallicities depend on the age of the stellar populations and the overall mix of stellar populations in a galaxy (i.e. the total duration of the SFH), affecting the strength of the features and the underlying degeneracies.
Samples used in the scientific analysis and mean uncertainties on the physical parameter estimates.
4.1. Stellar metallicities and ages
The derived estimates on r-band light-weighted stellar age and stellar metallicity are presented in the upper panels of Fig. 6, along with their associated uncertainties given by the 84th–16th inter-percentile width of the PDF. The distributions are presented for the silver and golden galaxies, distinguished into Q and SF as in Fig. 2. For completeness we illustrate also the distribution of parameters and parameter uncertainties for the whole parent DR3 sample. We find that LEGA-C galaxies span a range of light-weighted ages between roughly log⟨Age/yr⟩ = 8.9 and 9.8 (i.e. from ∼600 Myr to 6.3 Gyr), with Q galaxies dominating at ages older than log⟨Age/yr⟩ = 9.2 (1.6 Gyr). The light-weighted age is constrained typically to within 0.16 (0.15) dex for all (high-S/N) spectra, with no significant difference between Q and SF nor as a function of age.
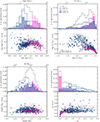 |
Fig. 6. Distribution in r-band light-weighted mean age (upper-left), r-band light-weighted mean stellar metallicity (upper-right), stellar mass (lower-left), and dust attenuation in the g-band (lower-right) for the LEGA-C silver and golden samples analysed in this work. For each parameter, the upper panel displays the distribution in the estimated parameter value (the median of the PDF). Magenta (blue) histograms show the distribution for the Q (SF) galaxies in the silver (hollow) and in the golden (hatched) sub-samples, both normalised to the total silver sample. Grey dot-dashed histograms (normalised to unit integral) display the whole LEGA-C parent sample regardless of the indices used in the fit. The lower panel shows the uncertainties (half of the 84–16 percentile range) in the parameter estimates against the fiducial values. Galaxies belonging to the silver sample are distinguished into Q (magenta circles) and SF (blue stars), with filled symbols highlighting galaxies in the golden sub-sample. |
LEGA-C galaxies are predominantly found to have super-solar metallicities up to 3 ⋅ Z⊙, including both Q and SF galaxies. The stellar metallicities of star-forming galaxies extend down to 0.1 ⋅ Z⊙. We notice that the highest metallicity values (log(Z*/Z⊙)≳0.4) that are close to the highest metallicity covered by the models may be biased low by ∼0.1 dex, and they tend to have asymmetric posterior distributions skewed towards lower metallicities. The saturation to high metallicity is however mitigated with respect to other works that are limited to an upper metallicity boundary of ∼1.6 ⋅ Z⊙ (log Z/Z⊙ = 0.2), i.e. approximately a factor 2 lower than ours (e.g. Bevacqua et al. 2024; Nersesian et al. 2025). As opposed to the light-weighted age, the uncertainties on stellar metallicity depend on both spectral quality and galaxy type. Stellar metallicity is typically constrained to within 0.17 dex for silver quiescent galaxies and to within 0.15 dex for the sub-sample of golden quiescent galaxies. The accuracy on stellar metallicity decreases to 0.34 dex and to 0.28 dex for silver and golden star-forming galaxies, respectively. These are the mean uncertainties, but we notice that uncertainties on stellar metallicity can extend up to 0.6 dex especially for low-S/N, low-metallicity star-forming galaxies. This highlights the intrinsic difficulty in constraining stellar metallicities for young/star-forming galaxies and the need for high-S/N spectroscopy covering the red metallic features.
4.2. Stellar masses and dust attenuations
The lower panels of Fig. 6 show the distributions in stellar mass and in rest-frame g-band dust attenuation (Ag), and their associated uncertainties. Our galaxy sample ranges between 1010 and 6 ⋅ 1011 M⊙ in stellar mass, with rather homogeneous uncertainties of 0.12 dex and 0.13 dex for Q and SF galaxies respectively. We have checked that the stellar masses we derive are in excellent agreement with those in the DR3 catalogue obtained from photometry-only Prospector fit, with a mean offset of only 0.02 dex and scatter of 0.11 (0.13) dex for Q (SF) galaxies. The majority of our galaxy sample, and in particular quiescent galaxies, show negligible or low dust attenuation. However a small fraction of quiescent galaxies and the majority of star forming galaxies have Ag larger than 0.5 mag. Uncertainties are between 0.2 and 0.4 mag, but can be up to 0.6 mag for lower-quality spectroscopic data or young galaxies for which the looser constraints on stellar metallicity give more freedom to dust attenuation. For galaxies with a significant fraction of stars younger than 107 yr (the “birth cloud” timescale), uncertainties are also boosted by degeneracies between the two dust components assumed in the Charlot & Fall (2000) dust attenuation model.
4.3. Comparison of light-weighted and mass-weighted properties
Together with light-weighted mean parameters, we also derive estimates of mass-weighted mean ages and metallicities. Note that these estimates are weighted on the present-day stellar mass, corresponding to the formed stellar mass reduced by the fraction of mass returned to the ISM. While these parameters would be potentially more physically relevant, they are also intrinsically more subject to systematics associated to the adopted SFH modelling. Fig. 7 compares the light-weighted and the mass-weighted properties for golden Q and SF galaxies. We notice that for Q galaxies the two weights lead to very similar mean stellar population properties, with mass-weighted ages on average 0.05 dex older, and mass-weighted metallicities consistent or only marginally smaller than light-weighted metallicities. For SF galaxies, mass-weighted ages are also always larger than light-weighted ones with differences spanning between zero and 0.4 dex. Mass-weighted stellar metallicities are typically smaller than light-weighted ones, up to 0.1 dex. This trend is expected from our parametrization of the metal enrichment history (which is monotonically increasing with time) and because older, less metal rich stellar generations weigh more in the mass-weighted metallicity with respect to the light-weighted one.
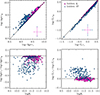 |
Fig. 7. Comparison between light-weighted and mass-weighted ages and stellar metallicities derived in this work for golden galaxies. Magenta circles indicate Q galaxies, blue stars indicate SF galaxies. The error bars show the median uncertainties for the two sub-samples. The upper panels show the 1:1 comparison, while the bottom panels show the difference between light- and mass-weighted quantities versus stellar mass. |
5. The stellar metallicity and age scaling relations in LEGA-C
In this section we quantify the distribution of the general population of massive (> 1010 M⊙) ⟨z⟩∼0.7 galaxies from the LEGA-C survey in mean stellar metallicity and age as a function of stellar mass and velocity dispersion. The reference population statistical trends are those obtained from the volume- and completeness-weighted silver sample, but we also present the results for the unweighted golden sample as a check against spectral quality.
5.1. Trends with stellar mass
Figure 8 shows the distribution of our sample galaxies in luminosity-weighted mean age (left panels) and in luminosity-weighted mean stellar metallicity (right panels) versus stellar mass. The upper panels display the individual measurements for the reference silver sample and for the high-S/N golden sub-sample. As already seen in Fig. 6, the high-S/N requirement tends to select against metal-poor or low-mass galaxies. The middle panels show the median trends of age and metallicity in bins of stellar mass 0.2 dex wide and with at least 5 galaxies. The golden squares with error bars show the median and dispersion in the parameter (expressed by the 84th–16th inter-percentile range of the distribution) limited to the golden sample, while the silver squares and error bars refer to the broader silver sample weighted for completeness by Tcor × w_spec_silver (see Sect. 2.4). Finally, the bottom panels compare the dispersion in age and metallicity at fixed mass (hexagons) with the mean parameter uncertainties (crosses) for the golden sample distribution (golden symbols) and the weighted silver sample distribution (silver symbols).
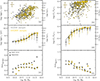 |
Fig. 8. Luminosity-weighted age (left panels) and luminosity-weighted stellar metallicity (right panels) versus stellar mass for LEGA-C galaxies. The upper panels show individual measurements. The silver sample is shown with silver circles and golden galaxies are highlighted with golden circles. Middle panels show the median age (panel c) and median stellar metallicity (d) in bins of stellar mass 0.2 dex wide and with at least five galaxies. Thick vertical error bars show the error on the median, while thin horizontal and vertical bars indicate the 16th–84th interpercentile range of the distribution. Silver filled squares refer to the silver sample weighted for completeness with Tcor × w_spec_silver, while golden filled (empty) squares refer to the golden sample without (with) weights. The corresponding lines in panel c (d) display the relation as in Eq. (1) that best fits the median values of age (metallicity) for the weighted silver and weighted golden sample respectively. The bottom panels compare the mean error on individual age and stellar metallicity estimates (crosses) with the dispersion, as given by the 16th–84th interpercentile range, at fixed stellar mass (hexagons), with silver (golden) symbols for silver (golden) sample. |
The distribution in light-weighted ages (Fig. 8a) indicates the presence of two sequences at ages younger/older than 3 Gyr (log⟨Age/yr⟩9.5), particularly evident for the golden sample. There is a clear trend of increasing age with increasing stellar mass, from ∼1.2 to ∼5 Gyr (log⟨Age/yr⟩ = 9.1 − 9.7) from 1010 to 1011.7 M⊙ (Fig. 8c). The larger and more complete statistics of the silver sample confirms the median trend of the robust, high-S/N golden sample, though with larger dispersion in some of the mass bins. The dispersion in light-weighted age is larger by 0.15 − 0.2 dex than the mean parameter uncertainty, across almost the whole range of stellar mass probed and in particular around 1011 M⊙. We notice that the larger dispersion in the silver sample is due both to the inclusion of lower-S/N galaxies and to the application of completeness weights (except in the highest-mass bin, which, however, suffers from low number statistics).
For a convenient quantification of the mean trend, we fit a parametric function to the median log⟨Age⟩r as a function of log(M*)8. Following Leja et al. (2019) and Nersesian et al. (2020), we find that the trend is well described by a sigmoidal functional form. Specifically, for a generic parameter P we parametrise the relation with M* as
 (1)
(1)
where  is the characteristic mass of inflection, A represents the dynamical range of the relation, B regulates the extent of the inflection range, and
normalises the relation so that  represents the zero-point at M* = 1011.5 M⊙.
For the median light-weighted age of the LEGA-C galaxies, the zero point at 1011.5 M⊙ corresponds to a value of log⟨Age⟩r = 9.62 ± 0.04 (4.2 Gyr). The inflection occurs at a stellar mass of 1.2 ± 0.4 ⋅ 1011 M⊙. The parameters of the fitted relation for the high-SN golden sample are consistent, with smaller uncertainties, with those of the weighted silver sample.
Unlike age, the distribution in stellar metallicity does not highlight the presence of two sequences. LEGA-C galaxies have predominantly high stellar metallicities, above solar, with a spread to lower metallicities down to 10% solar (Fig. 8b). Stellar metallicity increases on average from ∼30% solar to ∼3⋅ solar from 1010 to 1011.7 M⊙. The trend in log⟨Z*/Z⊙⟩ is steep at low masses and flattens above ∼6 ⋅ 1010 M⊙ (Fig. 8d). The dispersion in stellar metallicity at fixed mass is slightly larger than the mean parameter uncertainty at stellar masses above 1010.5 M⊙, while below 1010.5 M⊙ the uncertainties in stellar metallicity for the silver sample prevent a robust statement about the intrinsic dispersion in stellar metallicity.
To better quantify the trends as a function of stellar mass, we fit a curve to the median points. We adopt the same sigmoidal function in Eq. (1) as in the case of age, although the stellar metallicity–mass relation, in the mass range probed by our data, displays only the concave part above the inflection point. The stellar metallicity of the weighted silver sample reaches a value of log⟨Z*/Z⊙⟩ = 0.37 ± 0.04 at 1011.5 M⊙. The relation for the incomplete, higher-S/N golden sample saturates at a higher value of 0.46 ± 0.01.
The median trends and functional fits are reported in Tables 3 and 4. In Fig. D.1 in Appendix D, we compare the LEGA-C scaling relations with those we obtained at similar redshift but for a more limited sample in G14: under the same SPS modelling assumptions as in G14, we find consistent results, with LEGA-C being crucial in increasing the statistics and extending the scaling relations to lower masses. We notice, though, that the differences in modelling impact the normalisation of the scaling relations and the detailed shape of the galaxy distribution, in particular for the age bimodality.
5.2. Trends with stellar velocity dispersion
In Fig. 9 we explore how mean stellar ages and metallicities vary as a function of stellar velocity dispersion rather than stellar mass. The median trends and percentiles of the distributions are reported in Table 5, while the functional fits are summarised in Table 6. We find the same qualitative trends of increasing age and stellar metallicity with increasing σ*, similar to those observed as a function of stellar mass. The median light-weighted age increases rapidly by 0.6 dex (from ∼1 to ∼5 Gyr) over 0.6 dex in velocity dispersion. The same increase in age occurs over 1.7 dex in stellar mass. The rapid increase appears to result from a sequence of young galaxies with ages ∼1 − 2 Gyr (log⟨Age/yr⟩ = 9.1 − 9.3) spanning a relatively large range in σ*, which transitions to a more compact distribution of old galaxies between log σ* = 2.1 − 2.3. Across this transition regime the dispersion in light-weighted age is highest and larger than the typical uncertainty in age estimates. Above log σ* > 2.3 instead galaxies are more uniformly old. For convenience, we fit the same sigmoidal function as in Eq. (1), replacing M* with σ* and fixing the reference zero point at σ* = 102.4 km/s, which roughly corresponds to M* = 1011.5 M⊙ used as reference zero point for the relations with the stellar mass. The fit to the weighted silver distribution provides a light-weighted age of log⟨Age⟩r = 9.59 ± 0.03 at 102.4 km/s, with a transition at σ* = 236 ± 108 km/s ( ). The control golden sample confirms this trends with a more precise transition at σ* = 184 ± 4 km/s (Table 6).
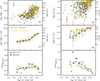 |
Fig. 9. Luminosity-weighted age (left panels) and luminosity-weighted stellar metallicity (right panels) versus stellar velocity dispersion for LEGA-C galaxies. Symbols and colours have the same meaning as in Fig. 8. The lines in panel c show the bestfit age–σ* relation using Eq. (1), while those in panel d show the bestfit linear log Z* − log σ* relation using Eq. (2). |
The right-hand panels show that galaxies follow a rather tight sequence in stellar metallicity above log σ* = 2.3. At lower velocity dispersions, the distribution in stellar metallicity broadens significantly. We measure a dispersion in stellar metallicity at fixed σ* larger than expected from the median uncertainty on metallicity estimates, both for the silver and golden sample, across almost the whole range in velocity dispersion. Unlike the trend with stellar mass, the increase in median stellar metallicity with σ* can be well described by a simple linear function:
 (2)
(2)
The median stellar metallicity reaches the value of log⟨Z*/Z⊙⟩ = 0.42 ± 0.03 at 102.4 km/s, and decreases with decreasing velocity dispersion with a slope of 1.2 ± 0.2. Unlike in the relation with stellar mass, we notice that the golden sample delivers a shallower slope for the Z* − σ* relation. The discrepancy likely originates from the different ranking of high-S/N galaxies in stellar mass rather than in stellar velocity dispersion: at masses below 1010.8 M⊙ the scatter in the M* − σ* relation increases and at fixed σ* lower-S/N galaxies tend to have lower M* than golden galaxies. Although the formal uncertainties are small, the slope of the relation could be subject to possible biases either in the golden sample due to incompleteness at lower σ* or in the silver sample due to larger uncertainties on stellar metallicity estimates. We tentatively apply statistical weight corrections to the medians of the golden sample (this is not done by default because such weights are very noisy due to the small number statistics of the golden sample). These are now shown as golden empty squares in Figs. 8 and 9. Despite the large scatter, the statistically corrected golden points are in agreement with the relation determined from the silver sample. This shows that the observed discrepancy in the distribution as a function of σ* between the uncorrected golden points and the silver sample is mainly due to the statistical incompleteness of the golden sample.
Comparing Fig. 8 with Fig. 9 it emerges that the dispersion in light-weighted age is higher at fixed M* than at fixed σ*. In particular, the dispersion at fixed σ* is comparable to the typical age uncertainties, and it is higher only across the transition from the young to the old sequence at σ ∼ 102.2 km/s. This suggests that below and above the transition regime in σ*, velocity dispersion is more predictive of the age of stellar populations, while stellar mass alone cannot predict the age of stellar populations. Stellar metallicity instead displays a similar dispersion with respect to the median uncertainties at fixed stellar mass (above 1010.7 M⊙) or at fixed velocity dispersion (above log σ* = 2.1), suggesting that both parameters are equally predictive of the stellar metallicity in massive galaxies. In the lower-mass regime, the dispersion in metallicity is lower at fixed mass than at fixed sigma.
6. Discussion
6.1. Downsizing and age bimodality
We find a downsizing trend such that the light-weighted mean ages of more massive galaxies are older than those of lower-mass galaxies. The median relation between luminosity-weighted age and stellar mass displays a sigmoidal behaviour which originates from the presence of an old and a young sequence of galaxies. The characteristic stellar mass across which the relation inflects (i.e. when it changes from being dominated by young galaxies to being dominated by old galaxies) is around 1011 M⊙. Such a non-linear, bimodal behaviour of the age distribution in the general galaxy population has been observed by several studies also in the local Universe, both as a function of the global mass or surface mass density (e.g. Kauffmann et al. 2003b; Baldry et al. 2004; Gallazzi et al. 2005; Mateus et al. 2006; Franx et al. 2008; Williams et al. 2010; Mattolini et al. 2025) and as a function of the local surface brightness or stellar mass surface density (e.g. Bell & de Jong 2000; González Delgado et al. 2014; Zibetti et al. 2017).
We observe a young and an old sequence also as a function of stellar velocity dispersion. The transition between the two regimes occurs around log σ* = 2.3, more abruptly than the transition as a function of stellar mass, leading to a significant intrinsic dispersion in age at fixed σ* around the transition regime. This trend and the transition regime are very similar to those found for the full LEGA-C sample (thus extending to z ∼ 1) in Nersesian et al. (2025) with ages estimated from Prospector and in Cappellari (2023) with pPXF. Cappellari (2023) discusses that the regime log σ* ∼ 2.3 corresponds to a ‘quenching boundary’ such that the SFHs of galaxies above this boundary have no young component (≲1 Gyr). The smaller scatter in age at fixed velocity dispersion, below and above the transition regime, with respect to that at fixed stellar mass, as well as the sharper transition from the young to the old regime, suggest that stellar velocity dispersion (the depth of the potential well) is a better predictor of the main stellar formation epoch than stellar mass (the integral of the SFH). This is in line with the conclusion from other works in the local Universe (e.g. van der Wel et al. 2009; Graves et al. 2009; Wake et al. 2012; McDermid et al. 2015). Figure 10 displays how light-weighted mean age maps in the stellar mass–velocity dispersion plane (left panel). A clear gradient of increasing age with increasing velocity dispersion is evident, especially for log σ* > 2.2. Following Scholz-Díaz et al. (2024) we compute Spearman partial correlation coefficients to better quantify the dependence of age on mass and on σ* (black lines in Fig. 10). The coefficients indicate that light-weighted age primarily depends on σ* (ρ = 0.44 ± 0.06) and secondarily on M* (ρ = 0.16 ± 0.08) as also illustrated by the vector representation in Fig. 10. Barone et al. (2022) found a slightly stronger dependence of age on M/R (a proxy for the gravitational potential) than on M, for LEGA-C quiescent galaxies, although the correlations were weaker than what we find.
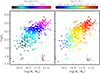 |
Fig. 10. Stellar mass–velocity dispersion plane colour-coded by light-weighted age (left) and light-weighted stellar metallicity (right). For visualisation purposes, the age and metallicity have been LOESS-smoothed. Vectors in the bottom right corner are proportional to the partial correlation coefficients, computed for the original (non-smoothed) physical parameters, following Scholz-Díaz et al. (2022, 2024). The red line marks the direction of maximal increase in age/metallicity. The grey vectors refer to a correlation coefficient of 0.5 for comparison. |
We have checked that a similar sigmoidal behaviour of age versus mass or velocity dispersion manifests also considering mass-weighted ages rather than light-weighted ones. A young and an old regime are still visible, with the young sequence shifted by 0.2 dex upward. However, the separation of the two sequences, and hence the bimodality, is reduced, as well as the scatter in mass-weighted age at fixed mass. This suggests that both the main formation epoch (to which mass-weighted age is most sensitive) and the duration of the star formation activity (which influences the difference between mass- and light-weighted ages) are a function of stellar mass, but a bimodality emerges mostly because of differences in the amount of the most recent star formation (affecting the light-weighted age).
A downsizing trend, that manifests as an increase in age (or decrease in formation times) with increasing stellar mass or velocity dispersion, is also observed in Kaushal et al. (2024) from the analysis of the same LEGA-C sample, for the population as a whole with both Bagpipes and Prospector, but with a systematic difference between the two methods and SFH assumptions. Tacchella et al. (2022) also describes two different regimes in the formation times for a sample of 160 massive galaxies in the redshift range z = 0.6 − 1 from the HALO7D spectroscopic survey. They find uniformly old ages for masses above 2 ⋅ 1011 M⊙, and a larger variation in both formation epoch and timescales at lower masses with a weaker mass dependence. Such a trend appears to extend beyond z = 1 as found in (Belli et al. 2015, 1 < z < 1.6) and in the VANDELS survey (Carnall et al. 2019; Hamadouche et al. 2022, 1 < z < 1.3).
6.2. Chemical downsizing
We find a clear trend of increasing stellar metallicity with increasing galaxy mass, thus suggesting that higher-mass galaxies have been more efficient in reaching a higher degree of chemical enrichment. Lower-mass galaxies are still building up their metal content and/or have experienced a more prolonged history of gas flows altering the metal enrichment history.
Contrary to age, a bimodality is not apparent in the stellar metallicity-mass plane. The distribution in stellar metallicities is characterised by a concentration of galaxies in a high-metallicity sequence accompanied by an increasing scatter towards low stellar metallicities with decreasing stellar mass. This leads to a rather flat relation at masses > 1010.8 M⊙, and a gradual steepening below this regime. This behaviour resembles the one already observed in the local Universe for the general galaxy population (Gallazzi et al. 2005; Panter et al. 2008; Mattolini et al. 2025) and for star-forming galaxies only (Zahid et al. 2017). Interestingly, the same rapid increase at low masses and the flattening at higher masses is followed by the gas-phase metallicity, as observed at various redshifts (e.g. Tremonti et al. 2004; Moustakas et al. 2011; Curti et al. 2020) and in the LEGA-C sample as well extending to higher masses than previous surveys at similar redshift (Lewis et al. 2024). It should be noted though that the stellar metallicity–mass relation is much more dispersed than the corresponding gas-phase relation. There are at least a couple of factors contributing to this difference: (i) the stellar metallicity-mass relation displayed here pertains to the global population, while the gas-phase mass-metallicity relation only to star-forming galaxies; (ii) the uncertainties on stellar metallicity become larger for lower-mass or younger galaxies, that are those for which gas-phase metallicities are better derived. The very broad similarity in the mass–metallicity relation for the stellar and the gas phase is non trivial, considering the different epochs of chemical enrichment that the two components trace. A combined analysis of the stellar and gas-phase metallicity scaling relations could constrain the efficiency of outflows in regulating star formation and metal enrichment timescales (e.g. Dalcanton 2007; Lu et al. 2015). However, systematic uncertainties in the different estimates of stellar and gas-phase metallicities should be treated with caution when making such comparison.
We find the median stellar metallicity to increase also as a function of stellar velocity dispersion. The trends we retrieve for the whole population are similar to those found by Cappellari (2023) with the FSPS or GALAXEV models and by Nersesian et al. (2025). Unlike with stellar mass, the median log Z* follows a linear trend with log σ* without an indication of a change in slope. This median linear trend results from an increasing scatter towards lower metallicities with decreasing σ*. Such a distribution may suggest the existence of a mass-dependent lower limit in metallicity, referred to as MEtallicity-Mass-Exclusion zone in Bevacqua et al. (2024). In contrast to their work though, we observe such a behaviour for the global population rather than for quiescent galaxies only (as we show in Paper II).
The statistics of our LEGA-C sample and the accuracy of the parameter estimates allowed us to measure an intrinsic scatter in addition to the measurement uncertainties at least in the mass range 1010.5 − 1011.5 M⊙ and in virtually the whole σ* range probed (80 − 250 km/s). This suggests that other parameters, such as the star formation activity or the galaxy structure, could regulate the metal enrichment. In Paper II we explore how the current star formation activity contributes to the scatter.
In the right-hand panel of Fig. 10 we show how the stellar metallicity varies in the M* − σ* plane. A gradient in stellar metallicity almost parallel to the relation is evident, becoming more aligned with the mass axis below ∼1010.8 M⊙. The Spearman partial correlation analysis indicates that stellar metallicity has a similarly strong dependence on stellar mass at fixed σ* as with velocity dispersion at fixed M* (partial correlation coefficients of 0.24 ± 0.07 and 0.19 ± 0.08 respectively, see also the vector representation in Fig. 10). This suggests that both the stellar mass and the velocity dispersion determine the degree of metal enrichment. This partially agrees with what found in Barone et al. (2018, 2022) analysing the mass-size plane, although they retrieved a stronger dependence on M/R (which traces the depth of the potential well). A similar relation between stellar velocity dispersion and stellar mass, and a similar trend of σ* with the gas-phase metallicity of spiral galaxies is found by Mogotsi & Romeo (2019) using CALIFA data. Our finding reinforces the idea that the metallicity is connected with the ability of a galaxy to retain metals, hence the global and local potential well, modulated by galaxy mass (e.g. Zibetti & Gallazzi 2022).
7. Summary
We have analysed the LEGA-C spectroscopic data to derive stellar population parameters and their scaling relations for volume-representative galaxy samples at redshift 0.6 < z < 0.77. We used our BaStA fitting code (Gallazzi et al. 2005; Zibetti et al. 2017) to interpret, in a Bayesian framework, optimally selected sets of stellar absorption features, in combination with rest-frame optical photometry, with a library of spectral models based on complex star formation and metal enrichment histories, and dust attenuations. We selected a silver subset of the LEGA-C sample, based on the availability of key absorption features sensitive to both age and metallicity, comprising 552 unique galaxies, 323 of which have S/N > 20 and constitute our golden sample. This work extends the analysis we performed in Gallazzi et al. (2014) with regard to modelling assumptions, sample size, and parameter coverage.
We analysed various sources of systematics that can affect the physical parameter estimates within our framework (Appendix D) as well as in comparison to other spectral fitting methods performed on the LEGA-C sample (Appendix E). We find that stellar metallicities are intrinsically more uncertain for younger or less-massive galaxies, owing to larger degeneracies in the underlying SFHs. Deep spectroscopy and complex modelling of key absorption features remain necessary to push metallicity studies to reach the lower-mass star-forming population. Assumptions on SFHs are the primary drivers of the systematic differences in the inferred ages, while the choice of SPS models and the treatment of CEHs have a significant impact on the normalisation of stellar metallicities. We find that parameter estimates on an individual galaxy basis are subject to significant scatter between different estimates. The uncertainties retrieved with BaStA to a large extent reflect this scatter and are thus representative of the underlying parameter degeneracies. This stresses the importance of applying consistent analysis when working on different datasets. Nevertheless, we find that the statistical trends obtained in this work are robust against different assumptions but differ in the detailed shape (see Appendix E).
We provide the catalogue of the stellar population’s physical parameters derived in this work with our BaStA code for the whole LEGA-C DR3 together with those estimated in previous works from the LEGA-C team using Prospector (Nersesian et al. 2025) and Bagpipes (Kaushal et al. 2024). We also provide a catalogue of revised absorption index measurements for both individual spectra and duplicate-combined observations.
With the well-defined silver and golden samples, we characterised the relations of luminosity-weighted age and stellar metallicity as a function of stellar mass and velocity dispersion for the general ⟨z⟩ = 0.7 galaxy population at masses greater than 1010 M⊙ by accounting for volume and survey completeness. We find that the archaeological downsizing trends of increasing age and increasing stellar metallicity with increasing mass, known in the local Universe, were already in place when the Universe was 7 Gyr old. We observed similar trends in stellar age and metallicity as a function of stellar velocity dispersion. A comparison of the scatter in the relations and of the gradient in age and metallicity in the M* − σ* plane suggests that age is primarily predicted by stellar velocity dispersion being below or above the characteristic transition regime of log σ* ∼ 2.3, while both the stellar mass (the integral of the SFH) and the velocity dispersion (the depth of the potential well) determine the degree of chemical enrichment of a galaxy’s stellar populations. In Paper II we quantify how these relations are different for quiescent and star-forming galaxies, describe how they evolve from z = 0.7 to z = 0.1, and discuss the implications for the population evolution. The shape and scatter in these relations at intermediate redshifts can provide important constraints to galaxy evolution models in the cosmological context and on the implementation of feedback and quenching mechanisms. This type of study represents a benchmark for the archaeological analysis of galaxies over a continuous span of cosmic time at z < 2, as will be obtained from the WEAVE (Iovino et al. 2023a), 4MOST (Iovino et al. 2023b; Driver et al. 2019), and MOONS (Maiolino et al. 2020) surveys for large representative galaxy samples as well as for increasing numbers of massive quiescent galaxies at even higher redshift from JWST (e.g. Valentino et al. 2023; Slob et al. 2024; Carnall et al. 2024).
Data availability
The catalogs including the measurements of absorption line indices and the inferred physical parameter estimates for LEGA-C DR3, as well as Tables 3 and 5, are available at the CDS via https://cdsarc.cds.unistra.fr/viz-bin/cat/J/A+A/708/A289 and on the public repository https://www.basta.inaf.it
Acknowledgments
We thank the referee for their suggestions to improve the clarity of the results and discussion. We are grateful to Stephane Charlot and Gustavo Bruzual for assistance with the CB19 SPS models. ARG and LSD acknowledge support from the INAF-Minigrant-2022 “LEGA-C” 1.05.12.04.01. SZ acknowledges support from the INAF-Minigrant-2023 “Enabling the study of galaxy evolution through unresolved stellar population analysis” 1.05.23.04.01. PFW acknowledges funding through the National Science and Technology Council grants 113-2112-M-002-027-MY2. LSD is supported by the “Prometeus” project PID2021-123313NA-I00 of MICIN/AEI/10.13039/501100011033/FEDER, UE. This paper and related research have been conducted during and with the support of the Italian national inter-university PhD programme in Space Science and Technology.
References
- Baldry, I. K., Glazebrook, K., Brinkmann, J., et al. 2004, ApJ, 600, 681 [Google Scholar]
- Baldry, I. K., Balogh, M. L., Bower, R. G., et al. 2006, MNRAS, 373, 469 [Google Scholar]
- Balogh, M. L., Morris, S. L., Yee, H. K. C., Carlberg, R. G., & Ellingson, E. 1999, ApJ, 527, 54 [Google Scholar]
- Barone, T. M., D’Eugenio, F., Colless, M., et al. 2018, ApJ, 856, 64 [Google Scholar]
- Barone, T. M., D’Eugenio, F., Scott, N., et al. 2022, MNRAS, 512, 3828 [NASA ADS] [CrossRef] [Google Scholar]
- Bell, E. F., & de Jong, R. S. 2000, MNRAS, 312, 497 [NASA ADS] [CrossRef] [Google Scholar]
- Belli, S., Newman, A. B., & Ellis, R. S. 2015, ApJ, 799, 206 [NASA ADS] [CrossRef] [Google Scholar]
- Bernardi, M., Sheth, R. K., Nichol, R. C., Schneider, D. P., & Brinkmann, J. 2005, AJ, 129, 61 [Google Scholar]
- Bevacqua, D., Saracco, P., Boecker, A., et al. 2024, A&A, 690, A150 [NASA ADS] [CrossRef] [EDP Sciences] [Google Scholar]
- Beverage, A. G., Kriek, M., Conroy, C., et al. 2023, ApJ, 948, 140 [NASA ADS] [CrossRef] [Google Scholar]
- Beverage, A. G., Slob, M., Kriek, M., et al. 2025, ApJ, 979, 249 [Google Scholar]
- Bezanson, R., van der Wel, A., Pacifici, C., et al. 2018, ApJ, 858, 60 [NASA ADS] [CrossRef] [Google Scholar]
- Bruzual, G., & Charlot, S. 2003, MNRAS, 344, 1000 [NASA ADS] [CrossRef] [Google Scholar]
- Cappellari, M. 2023, MNRAS, 526, 3273 [NASA ADS] [CrossRef] [Google Scholar]
- Cappellari, M., Bacon, R., Bureau, M., et al. 2006, MNRAS, 366, 1126 [Google Scholar]
- Carnall, A. C., McLure, R. J., Dunlop, J. S., et al. 2019, MNRAS, 490, 417 [Google Scholar]
- Carnall, A. C., McLure, R. J., Dunlop, J. S., et al. 2022, ApJ, 929, 131 [NASA ADS] [CrossRef] [Google Scholar]
- Carnall, A. C., Cullen, F., McLure, R. J., et al. 2024, MNRAS, 534, 325 [NASA ADS] [CrossRef] [Google Scholar]
- Catinella, B., Saintonge, A., Janowiecki, S., et al. 2018, MNRAS, 476, 875 [NASA ADS] [CrossRef] [Google Scholar]
- Chabrier, G. 2003, PASP, 115, 763 [Google Scholar]
- Charlot, S., & Fall, S. M. 2000, ApJ, 539, 718 [Google Scholar]
- Chauke, P., van der Wel, A., Pacifici, C., et al. 2018, ApJ, 861, 13 [NASA ADS] [CrossRef] [Google Scholar]
- Chauke, P., van der Wel, A., Pacifici, C., et al. 2019, ApJ, 877, 48 [NASA ADS] [CrossRef] [Google Scholar]
- Chen, Y., Bressan, A., Girardi, L., et al. 2015, MNRAS, 452, 1068 [Google Scholar]
- Chen, Z., Faber, S. M., Koo, D. C., et al. 2020, ApJ, 897, 102 [NASA ADS] [CrossRef] [Google Scholar]
- Choi, J., Conroy, C., Moustakas, J., et al. 2014, ApJ, 792, 95 [Google Scholar]
- Cowie, L. L., Songaila, A., Hu, E. M., & Cohen, J. G. 1996, AJ, 112, 839 [Google Scholar]
- Cullen, F., McLure, R. J., Dunlop, J. S., et al. 2019, MNRAS, 487, 2038 [Google Scholar]
- Curti, M., Mannucci, F., Cresci, G., & Maiolino, R. 2020, MNRAS, 491, 944 [Google Scholar]
- da Cunha, E., Charlot, S., & Elbaz, D. 2008, MNRAS, 388, 1595 [Google Scholar]
- Dalcanton, J. J. 2007, ApJ, 658, 941 [CrossRef] [Google Scholar]
- de Graaff, A., Bezanson, R., Franx, M., et al. 2021, ApJ, 913, 103 [CrossRef] [Google Scholar]
- Dekel, A., & Birnboim, Y. 2006, MNRAS, 368, 2 [NASA ADS] [CrossRef] [Google Scholar]
- D’Eugenio, F., van der Wel, A., Wu, P.-F., et al. 2020, MNRAS, 497, 389 [CrossRef] [Google Scholar]
- D’Eugenio, F., van der Wel, A., Piotrowska, J. M., et al. 2023a, MNRAS, 525, 2789 [CrossRef] [Google Scholar]
- D’Eugenio, F., van der Wel, A., Derkenne, C., et al. 2023b, MNRAS, 525, 2765 [CrossRef] [Google Scholar]
- Driver, S. P., Liske, J., Davies, L. J. M., et al. 2019, The Messenger, 175, 46 [NASA ADS] [Google Scholar]
- Erb, D. K. 2008, ApJ, 674, 151 [NASA ADS] [CrossRef] [Google Scholar]
- Erb, D. K., Steidel, C. C., Shapley, A. E., et al. 2006, ApJ, 646, 107 [NASA ADS] [CrossRef] [Google Scholar]
- Estrada-Carpenter, V., Papovich, C., Momcheva, I., et al. 2019, ApJ, 870, 133 [NASA ADS] [CrossRef] [Google Scholar]
- Falcón-Barroso, J., Sánchez-Blázquez, P., Vazdekis, A., et al. 2011, A&A, 532, A95 [Google Scholar]
- Ferreras, I., Pasquali, A., Malhotra, S., et al. 2009, ApJ, 706, 158 [NASA ADS] [CrossRef] [Google Scholar]
- Ferreras, I., Pasquali, A., Pirzkal, N., et al. 2019, MNRAS, 486, 1358 [Google Scholar]
- Fontanot, F., De Lucia, G., Monaco, P., Somerville, R. S., & Santini, P. 2009, MNRAS, 397, 1776 [NASA ADS] [CrossRef] [Google Scholar]
- Franx, M., van Dokkum, P. G., Förster Schreiber, N. M., et al. 2008, ApJ, 688, 770 [NASA ADS] [CrossRef] [Google Scholar]
- Gallazzi, A., Charlot, S., Brinchmann, J., White, S. D. M., & Tremonti, C. A. 2005, MNRAS, 362, 41 [Google Scholar]
- Gallazzi, A., Charlot, S., Brinchmann, J., & White, S. D. M. 2006, MNRAS, 370, 1106 [Google Scholar]
- Gallazzi, A., Bell, E. F., Zibetti, S., Brinchmann, J., & Kelson, D. D. 2014, ApJ, 788, 72 [Google Scholar]
- Gallazzi, A. R., Pasquali, A., Zibetti, S., & Barbera, F. L. 2021, MNRAS, 502, 4457 [NASA ADS] [CrossRef] [Google Scholar]
- Gallazzi, A. R., Zibetti, S., van der Wel, A., et al. 2026, A&A, in press, https://doi.org/10.1051/0004-6361/202554981 [Google Scholar]
- Garcia, A. M., Torrey, P., Grasha, K., et al. 2024, MNRAS, 529, 3342 [Google Scholar]
- Gavazzi, G., Bonfanti, C., Sanvito, G., Boselli, A., & Scodeggio, M. 2002, ApJ, 576, 135 [NASA ADS] [CrossRef] [Google Scholar]
- González Delgado, R. M., Pérez, E., Cid Fernandes, R., et al. 2014, A&A, 562, A47 [CrossRef] [EDP Sciences] [Google Scholar]
- Graves, G. J., Faber, S. M., & Schiavon, R. P. 2009, ApJ, 693, 486 [CrossRef] [Google Scholar]
- Gutkin, J., Charlot, S., & Bruzual, G. 2016, MNRAS, 462, 1757 [Google Scholar]
- Halliday, C., Daddi, E., Cimatti, A., et al. 2008, A&A, 479, 417 [NASA ADS] [CrossRef] [EDP Sciences] [Google Scholar]
- Hamadouche, M. L., Carnall, A. C., McLure, R. J., et al. 2022, MNRAS, 512, 1262 [NASA ADS] [CrossRef] [Google Scholar]
- Iovino, A., Poggianti, B. M., Mercurio, A., et al. 2023a, A&A, 672, A87 [NASA ADS] [CrossRef] [EDP Sciences] [Google Scholar]
- Iovino, A., Mercurio, A., Gallazzi, A. R., et al. 2023b, The Messenger, 190, 22 [NASA ADS] [Google Scholar]
- Jorgensen, I., & Chiboucas, K. 2013, arXiv e-prints [arXiv:1301.3177] [Google Scholar]
- Jørgensen, I., Bergmann, M., Davies, R., et al. 2005, AJ, 129, 1249 [CrossRef] [Google Scholar]
- Kauffmann, G., Heckman, T. M., White, S. D. M., et al. 2003a, MNRAS, 341, 33 [Google Scholar]
- Kauffmann, G., Heckman, T. M., White, S. D. M., et al. 2003b, MNRAS, 341, 54 [Google Scholar]
- Kaushal, Y., Nersesian, A., Bezanson, R., et al. 2024, ApJ, 961, 118 [NASA ADS] [CrossRef] [Google Scholar]
- Kriek, M., Price, S. H., Conroy, C., et al. 2019, ApJ, 880, L31 [NASA ADS] [CrossRef] [Google Scholar]
- Kuntschner, H., Emsellem, E., Bacon, R., et al. 2010, MNRAS, 408, 97 [Google Scholar]
- Leethochawalit, N., Kirby, E. N., Ellis, R. S., Moran, S. M., & Treu, T. 2019, ApJ, 885, 100 [NASA ADS] [CrossRef] [Google Scholar]
- Leja, J., Johnson, B. D., Conroy, C., et al. 2019, ApJ, 877, 140 [NASA ADS] [CrossRef] [Google Scholar]
- Lewis, Z. J., Andrews, B. H., Bezanson, R., et al. 2024, ApJ, 964, 59 [NASA ADS] [CrossRef] [Google Scholar]
- Lilly, S. J., Carollo, C. M., Pipino, A., Renzini, A., & Peng, Y. 2013, ApJ, 772, 119 [NASA ADS] [CrossRef] [Google Scholar]
- Lonoce, I., Longhetti, M., Maraston, C., et al. 2015, MNRAS, 454, 3912 [Google Scholar]
- Looser, T. J., D’Eugenio, F., Piotrowska, J. M., et al. 2024, MNRAS, 532, 2832 [NASA ADS] [CrossRef] [Google Scholar]
- Lu, Y., Blanc, G. A., & Benson, A. 2015, ApJ, 808, 129 [NASA ADS] [CrossRef] [Google Scholar]
- Madau, P., & Dickinson, M. 2014, ARA&A, 52, 415 [Google Scholar]
- Magg, E., Bergemann, M., Serenelli, A., et al. 2022, A&A, 661, A140 [NASA ADS] [CrossRef] [EDP Sciences] [Google Scholar]
- Maiolino, R., Nagao, T., Grazian, A., et al. 2008, A&A, 488, 463 [NASA ADS] [CrossRef] [EDP Sciences] [Google Scholar]
- Maiolino, R., Cirasuolo, M., Afonso, J., et al. 2020, The Messenger, 180, 24 [NASA ADS] [Google Scholar]
- Mateus, A., Sodré, L., Cid Fernandes, R., et al. 2006, MNRAS, 370, 721 [NASA ADS] [CrossRef] [Google Scholar]
- Mattolini, D., Zibetti, S., Gallazzi, A. R., Scholz-Díaz, L., & Pratesi, J. 2025, A&A, 703, A5 [NASA ADS] [CrossRef] [EDP Sciences] [Google Scholar]
- McDermid, R. M., Alatalo, K., Blitz, L., et al. 2015, MNRAS, 448, 3484 [Google Scholar]
- Mogotsi, K. M., & Romeo, A. B. 2019, MNRAS, 489, 3797 [Google Scholar]
- Moustakas, J., Zaritsky, D., Brown, M., et al. 2011, arXiv e-prints [arXiv:1112.3300] [Google Scholar]
- Muzzin, A., Marchesini, D., Stefanon, M., et al. 2013a, ApJS, 206, 8 [Google Scholar]
- Muzzin, A., Marchesini, D., Stefanon, M., et al. 2013b, ApJ, 777, 18 [NASA ADS] [CrossRef] [Google Scholar]
- Nersesian, A., Verstocken, S., Viaene, S., et al. 2020, A&A, 637, A25 [NASA ADS] [CrossRef] [EDP Sciences] [Google Scholar]
- Nersesian, A., van der Wel, A., Gallazzi, A. R., et al. 2025, A&A, 695, A86 [NASA ADS] [CrossRef] [EDP Sciences] [Google Scholar]
- Onodera, M., Carollo, C. M., Renzini, A., et al. 2015, ApJ, 808, 161 [NASA ADS] [CrossRef] [Google Scholar]
- Oyarzún, G. A., Bundy, K., Westfall, K. B., et al. 2022, ApJ, 933, 88 [Google Scholar]
- Panter, B., Jimenez, R., Heavens, A. F., & Charlot, S. 2008, MNRAS, 391, 1117 [Google Scholar]
- Pasquali, A., van den Bosch, F. C., Mo, H. J., Yang, X., & Somerville, R. 2009, MNRAS, 394, 38 [Google Scholar]
- Pasquali, A., Gallazzi, A., Fontanot, F., et al. 2010, MNRAS, 407, 937 [NASA ADS] [CrossRef] [Google Scholar]
- Plat, A., Charlot, S., Bruzual, G., et al. 2019, MNRAS, 490, 978 [Google Scholar]
- Renzini, A. 2006, ARA&A, 44, 141 [NASA ADS] [CrossRef] [Google Scholar]
- Rix, S. A., Pettini, M., Leitherer, C., et al. 2004, ApJ, 615, 98 [Google Scholar]
- Rossi, E. 2025, arXiv e-prints [arXiv:2507.06006] [Google Scholar]
- Saintonge, A., Kauffmann, G., Kramer, C., et al. 2011, MNRAS, 415, 32 [NASA ADS] [CrossRef] [Google Scholar]
- Sánchez, S. F., Barrera-Ballesteros, J. K., Lacerda, E., et al. 2022, ApJS, 262, 36 [CrossRef] [Google Scholar]
- Sánchez-Blázquez, P., Jablonka, P., Noll, S., et al. 2009, A&A, 499, 47 [Google Scholar]
- Sandage, A. 1986, A&A, 161, 89 [NASA ADS] [Google Scholar]
- Saracco, P., Marchesini, D., La Barbera, F., et al. 2020, ApJ, 905, 40 [NASA ADS] [CrossRef] [Google Scholar]
- Schiavon, R. P., Faber, S. M., Konidaris, N., et al. 2006, ApJ, 651, L93 [Google Scholar]
- Scholz-Díaz, L., Martín-Navarro, I., & Falcón-Barroso, J. 2022, MNRAS, 511, 4900 [CrossRef] [Google Scholar]
- Scholz-Díaz, L., Martín-Navarro, I., Falcón-Barroso, J., Lyubenova, M., & van de Ven, G. 2024, Nat. Astron., 8, 648 [Google Scholar]
- Shen, S., Mo, H. J., White, S. D. M., et al. 2003, MNRAS, 343, 978 [NASA ADS] [CrossRef] [Google Scholar]
- Slob, M., Kriek, M., Beverage, A. G., et al. 2024, ApJ, 973, 131 [Google Scholar]
- Somerville, R. S., & Davé, R. 2015, ARA&A, 53, 51 [Google Scholar]
- Sommariva, V., Mannucci, F., Cresci, G., et al. 2012, A&A, 539, A136 [NASA ADS] [CrossRef] [EDP Sciences] [Google Scholar]
- Stanton, T. M., Cullen, F., McLure, R. J., et al. 2024, MNRAS, 532, 3102 [Google Scholar]
- Stockmann, M., Toft, S., Gallazzi, A., et al. 2020, ApJ, 888, 4 [Google Scholar]
- Straatman, C. M. S., van der Wel, A., Bezanson, R., et al. 2018, ApJS, 239, 27 [NASA ADS] [CrossRef] [Google Scholar]
- Tacchella, S., Conroy, C., Faber, S. M., et al. 2022, ApJ, 926, 134 [NASA ADS] [CrossRef] [Google Scholar]
- Thomas, D., Maraston, C., & Bender, R. 2003, MNRAS, 339, 897 [NASA ADS] [CrossRef] [Google Scholar]
- Thomas, D., Maraston, C., & Korn, A. 2004, MNRAS, 351, L19 [NASA ADS] [CrossRef] [Google Scholar]
- Thomas, D., Maraston, C., Bender, R., & Mendes de Oliveira, C. 2005, ApJ, 621, 673 [Google Scholar]
- Thomas, D., Maraston, C., Schawinski, K., Sarzi, M., & Silk, J. 2010, MNRAS, 404, 1775 [NASA ADS] [Google Scholar]
- Toft, S., Gallazzi, A., Zirm, A., et al. 2012, ApJ, 754, 3 [NASA ADS] [CrossRef] [Google Scholar]
- Trager, S. C., Faber, S. M., Worthey, G., & González, J. J. 2000, AJ, 120, 165 [NASA ADS] [CrossRef] [Google Scholar]
- Tremonti, C. A., Heckman, T. M., Kauffmann, G., et al. 2004, ApJ, 613, 898 [Google Scholar]
- Trussler, J., Maiolino, R., Maraston, C., et al. 2020, MNRAS, 491, 5406 [Google Scholar]
- Valentino, F. M., Brammer, G., Ceverino, D., et al. 2023, A Deep Dive into the Physics of the First Massive Quiescent Galaxies in the Universe, JWST Proposal. Cycle 2, 3567 [Google Scholar]
- van der Wel, A., Bell, E. F., van den Bosch, F. C., Gallazzi, A., & Rix, H.-W. 2009, ApJ, 698, 1232 [NASA ADS] [CrossRef] [Google Scholar]
- van der Wel, A., Noeske, K., Bezanson, R., et al. 2016, ApJS, 223, 29 [Google Scholar]
- van der Wel, A., Bezanson, R., D’Eugenio, F., et al. 2021, ApJS, 256, 44 [NASA ADS] [CrossRef] [Google Scholar]
- van der Wel, A., van Houdt, J., Bezanson, R., et al. 2022, ApJ, 936, 9 [NASA ADS] [CrossRef] [Google Scholar]
- van Houdt, J., van der Wel, A., Bezanson, R., et al. 2021, ApJ, 923, 11 [CrossRef] [Google Scholar]
- Vazdekis, A., & Arimoto, N. 1999, ApJ, 525, 144 [NASA ADS] [CrossRef] [Google Scholar]
- Wake, D. A., van Dokkum, P. G., & Franx, M. 2012, ApJ, 751, L44 [NASA ADS] [CrossRef] [Google Scholar]
- Williams, R. J., Quadri, R. F., Franx, M., et al. 2010, ApJ, 713, 738 [NASA ADS] [CrossRef] [Google Scholar]
- Woodrum, C., Williams, C. C., Rieke, M., et al. 2022, ApJ, 940, 39 [NASA ADS] [CrossRef] [Google Scholar]
- Worthey, G., & Ottaviani, D. L. 1997, ApJS, 111, 377 [CrossRef] [Google Scholar]
- Worthey, G., Faber, S. M., Gonzalez, J. J., & Burstein, D. 1994, ApJS, 94, 687 [Google Scholar]
- Wu, P.-F., van der Wel, A., Gallazzi, A., et al. 2018a, ApJ, 855, 85 [Google Scholar]
- Wu, P.-F., van der Wel, A., Bezanson, R., et al. 2018b, ApJ, 868, 37 [NASA ADS] [CrossRef] [Google Scholar]
- Wu, P.-F., Nelson, D., van der Wel, A., et al. 2021, AJ, 162, 201 [NASA ADS] [CrossRef] [Google Scholar]
- Zahid, H. J., Geller, M. J., Kewley, L. J., et al. 2013, ApJ, 771, L19 [NASA ADS] [CrossRef] [Google Scholar]
- Zahid, H. J., Kudritzki, R.-P., Conroy, C., Andrews, B., & Ho, I. T. 2017, ApJ, 847, 18 [Google Scholar]
- Zibetti, S., & Gallazzi, A. R. 2022, MNRAS, 512, 1415 [NASA ADS] [CrossRef] [Google Scholar]
- Zibetti, S., Gallazzi, A. R., Ascasibar, Y., et al. 2017, MNRAS, 468, 1902 [NASA ADS] [Google Scholar]
As a reference S/N we take the LEGA-C DR3 catalogue entry SN_RF_4000 which is the S/N per pixel at 4000 Å rest-frame. In the case of duplicate observations we take the squared sum of the individual S/N values.
To fit the SFMS, we used galaxies that would be classified as star-forming according to their location in the UVJ diagram (rightwards of the dashed segment in the right panel).
Note that this is lower than the most recent estimate of Z⊙ = 0.0225 (Magg et al. 2022).
See Equations (4) and (6) in Zibetti et al. (2017) for the exact definition of light-weighted mean age. The analogous definition applies to the light-weighted mean metallicity.
For convenience we report the definition of the composite indices: ![Mathematical equation: $ \mathrm{[MgFe]}\prime = \sqrt{\mathrm{Mgb}\times (0.72\times \mathrm{Fe5270} + 0.28\times \mathrm{Fe5335})} $](/articles/aa/full_html/2026/04/aa54922-25/aa54922-25-eq86.gif)
[Mg2Fe] = 0.6 × Mg2 + 0.4 × log(Fe4531 + Fe5015)
[MgFe50]′ = 0.5 × (0.69 × Mgb + Fe5015)
[MgFe52]′ = 0.5 × (0.64 × Mgb + Fe5270).
Note that we ran our fitting procedure on all the LEGA-C DR3 galaxies. We provide a catalogue of derived stellar population parameters for the whole DR3 since this may be useful for some science applications that are not interested in stellar metallicity (which critically require the availability of Mg and Fe features).
Notice that this differs from the approach used in our previous works (see Gallazzi et al. 2005, 2014) where dust attenuation was estimated from the excess between the observed colour and the best-fit dust-free model based on an index-only fit.
To fit scaling relations, we use the MPFIT IDL routine which finds the bestfit parameters of the supplied function by minimising the sum of the weighted squared differences between the model and data. The fits are performed on the median values in bins of stellar mass accounting for the error on the median.
This excludes the indices [MgFe50]′ and [MgFe52]′, which were not measured for the SDSS DR7 and G14 sample.
Appendix A: New catalogue of absorption indices and quality of measurements
After the DR3 was released we discovered that a fraction of ∼15% of LEGA-C spectra did not receive a measurement of the absorption indices, despite the good quality of the spectrum and the lack of artefacts. This was tracked down to be related to a silent bug in the run of pPXF associated with the rebinning of the spectra. We thus re-processed the emission-line subtracted spectra for cleaning and index measurement. We then measure absorption indices with our routine BaStA_index and provide the revised catalogue of index measurements. Measurements are provided for all the LEGA-C spectra, but we consider the measurement reliable only if less than one-third of the pixels in any of the central or side bands are flagged. We thus recovered the index measurements for the ∼15% of LEGA-C spectra that were affected by the bug. The exact fraction varies from index to index because of the varying wavelength coverage. The revised index measurements are fully consistent with those previously published in the DR3 catalogue for those galaxies that already had a measurement, with a scatter well within the measurement uncertainties. We notice that the index measurement errors are instead systematically lower by a factor of 1.3 with respect to those already published, due to an erroneous scaling of the noise spectrum during index measurement in the previous release.
The quality of the index measurements can be expressed in terms of "resolving power", defined as the 5th − 95th inter-percentile range of the index strength in the data divided by the individual observational error. In Fig. A.1 we show the resolving power of the key absorption features used in this work for the LEGA-C sample analysed. For comparison the distributions of resolving power for SDSS DR7 galaxies and for the z = 0.7 Gallazzi et al. (2014) sample are shown.9
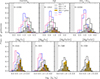 |
Fig. A.1. Resolving power of the absorption indices used in this work. The resolving power is defined as the index dynamic range of the observed sample divided by the observational error on each index measure. The solid black histograms include all the galaxies with a valid measurement of the given absorption index among the 2588 unique galaxies in the LEGA-C primary sample with a measurement of stellar velocity dispersion. Each histogram is normalised by the total number of galaxies used, N, which is reported in each panel. The dark and light grey hatched histograms refer to the Q and SF LEGA-C galaxies, respectively. The golden histograms refer to the golden sub-sample used in this work. All these histograms are normalised by N. The distributions for LEGA-C galaxies are compared, when available, to those of SDSS DR7 (blue) and of G14 (magenta) samples, each normalised by their total number of galaxies. |
We notice that the quality of index measurements in our LEGA-C sample is typically higher than that of SDSS DR7 for most indices, and higher than in G14 across the board. Among the Balmer indices, Hβ has lower resolving power because of the larger uncertainties in corrections for emission line infill. Among the metal-sensitive indices, [Mg2Fe] has higher resolving power because of the use of more spectral information. We also notice that, with the exception of D4000n, the resolving power is higher for quiescent galaxies than for star-forming ones.
As a further quality check of the index measurement and their fit, in Fig. 4 and Fig. 5, we compare the value of the observed absorption index with that of the best-fit model for the indices considered in the BaStA fit. The agreement is generally very good, with negligible mean offsets between observed and predicted index strengths, and scatter consistent with or only slightly larger than the mean observational uncertainties. The largest deviations are typically associated to galaxies for which the index has not been used in the fit. We notice small systematic offsets for golden quiescent galaxies for which the models tend to predict weaker D4000n and stronger Hβ. The best-fit model reproduces well, with scatter consistent with observational errors, the other absorption indices that are not used in the fit. The exceptions are Mg indices and red Fe indices for quiescent galaxies, a possible indication of α-enhancement which is not included in the modelling. We checked that these offsets are present to an equal or slightly larger extent for models based on exponential SFH and BC03 models.
We release the catalogue of revised index measurements for the whole LEGA-C DR3, both measured from individual emission-line subtracted spectra and obtained by combining duplicate observations when available as described in Sec. 2. We provide measurements for all the Lick indices, D4000n and the composite Mg-Fe indices, together with their errors, resolving power, warning flags, as well as flags for duplicate treatment.
Appendix B: Comparison of parameters from duplicate observations
We take advantage of duplicate observations in LEGA-C to test the reliability of the uncertainties on stellar population parameters. In order to quantify how much the observational set-up can affect our stellar population parameter estimates, we compare the parameters derived from duplicate observations of the same galaxies, in a similar way as it has been done for observational quantities such as absorption indices. We consider galaxies belonging to the silver sample and that have one or two duplicate observations. The difference in luminosity-weighted ages between duplicates has a standard deviation of 0.18 dex to be compared with the mean uncertainty on individual age estimates of 0.16 dex. The difference in luminosity-weighted stellar metallicity has a standard deviation of 0.33 dex which is fully consistent with the mean uncertainty on individual metallicity estimates for star-forming galaxies. We note that duplicate observations can cover slightly different wavelength ranges and sample a different portion of the galaxy light. Moreover, duplicate observations would differ also because of uncertainties on the stellar continuum modelling and decoupling of emission lines. This comparison shows that these effects do not impact significantly the parameter estimates of individual galaxies, whose uncertainties are well represented by those estimated with BaStA.
As explained in Sec. 2.3, in order to increase the sample of galaxies with spectroscopic coverage of the key absorption features, we combine duplicate observations when available. Fig. B.1 compares the parameter estimates obtained from the combined observations (i.e. using weighted mean absorption indices) with those obtained on the individual observations for the same object. This figure shows a good correlation between the two sets of estimates, with those based on the combined duplicate observations lying typically in between those based on individual observations. The mean uncertainties on parameters based on the combined observations are smaller than those based on the individual observations (0.16 dex compared to 0.18 dex for age, 0.27 dex compared to 0.34 dex for metallicity). The availability of a larger number of indices, in particular the five optimal indices (D4000n, Hβ, HδA+HγA, [Mg2Fe], [MgFe]′), has a larger impact on stellar metallicity estimates, with mean uncertainties reducing to 0.18 dex. This comparison reassures us that our procedure of combining duplicate observations is reliable and effective.
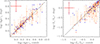 |
Fig. B.1. Comparison of light-weighted ages (left) and light-weighted stellar metallicities (right) obtained for individual duplicate observations (y-axis; duplicate measurements for each galaxy are connected with a dashed line) with those obtained from the duplicate-combined indices (x-axis). Filled symbols refer to those galaxies whose fit is constrained by the full set of five optimal indices (D4000n, Hβ, HδA+HγA, [Mg2Fe], [MgFe]′) when duplicate observations are combined. The error bars indicate the mean uncertainties in each estimate, with the thicker error bars referring to estimates based on the five optimal indices. |
Appendix C: Impact of dust modelling
We allowed for a large flexibility of dust attenuation in our model library, setting a broad prior on the dust parameters, with the purpose of avoiding the fit to be driven by a too limited range in dust attenuation while at the same time being able to constrain dust and stellar mass as well. A concern may be that this large range of dust attenuations in the model library may bias the estimates for quiescent galaxies to larger attenuations and consequently to lower ages or metallicities. We have checked that the combination of indices and photometry is able to isolate old from dusty models and reduce the degeneracy between age, metallicity and dust. In particular, we have checked that the apparently young ages of quiescent galaxies are not driven by an overestimation of the dust attenuation and the age-dust degeneracy. Indeed, the estimated dust attenuations for LEGA-C galaxies, based on indices and photometry, correlate well with the expectations based on the location in the UVJ diagram (Fig. C.1 left) and on the 24μm emission (Fig. C.1 right) normalised to their optical emission (as traced by the observed J-band magnitude). In particular, Q galaxies are characterised by low dust attenuation as expected. This reassures that the treatment of dust does not significantly bias our estimates of stellar population parameters. We have repeated the fit using only models with a dust attenuation Ag < 0.2 mag to quantify the impact on the stellar populations of quiescent galaxies: the metallicity of quiescent galaxies would be systematically lower by only 0.05 dex on average with scatter consistent with the uncertainties; the majority of Q galaxies have ages consistent between the two fits, with a median (mean) offset of 0.07 (0.1) dex, while only 8% of the quiescent galaxies, mainly of S/N < 20, have ages older by more than 0.3 dex (which corresponds to 2σ) in the case of low dust. Moreover, using only absorption indices as constraints to models with Ag < 0.2 mag gives stellar metallicity and light-weighted age estimates for quiescent galaxies consistent with those obtained using both indices and photometry as constraints to the full suite of (dust-attenuated) models, with negligible bias and with scatter lower than the uncertainties. This reinforces the confidence on the ability of our approach in separating age-metallicity-dust effects.
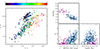 |
Fig. C.1. Comparison between estimated dust attenuation and expectations based on spectro-photometric diagnostics. Left-hand figure: Distribution in rest-frame U-V, V-J colour for our sample galaxies. Filled (empty) symbols refer to the golden (silver) sample, while circles and stars distinguish Q and SF galaxies. The colour-coding indicates the dust attenuation Ag estimated from BaStA fitting of spectral indices and rizYJ photometry. Right-hand figure: distribution in 4000Å-break versus J − 24 μm colour (upper panel) and in estimated dust attenuation Ag versus J − 24 μm colour (lower-left panel) or versus stellar mass (lower-right panel). |
Appendix D: Comparison of parameter estimates based on different assumptions in the BaStA method
Here we quantify the systematics introduced by different modelling assumptions between the model library adopted in this work and the one used in our previous works, with which the LEGA-C results are compared (Gallazzi et al. 2005, 2014). The model library adopted in this work and the one adopted in our previous series of works differ under several aspects: 1) the SPS code and stellar library adopted as base models (CB19 with MILES instead of BC03 with Stelib stellar library), 2) the SFHs (delayed Gaussian instead of exponentially declining for the smooth component, and different parametrization of the bursts), 3) the chemical enrichment history (metallicity increasing with the mass formed instead of metallicity constant along the SFH). These changes add more realistic complexity in the interpretation of galaxy spectra. We quantify the contribution of each ingredient to the overall difference between the estimated parameters in the LEGA-C sample. A full description of the systematic differences in the SDSS analysis is presented in Mattolini et al. (2025). This is not meant to be a comprehensive analysis of the systematics associated to different models, but to provide both a quantitative assessment of the differences between our previous results and a sense of the impact of different ingredients.
We focus on the silver sample and perform the indices+photometry BaStA fit as described in Sec. 3 adopting model libraries that differ from the default model library used in this work by one ingredient at a time among the three mentioned above. Specifically, we consider: i) a library that differs from the default one in the base SPS models used, namely the original BC03 SSPs instead of the CB19, which differ both in the stellar library (Stelib vs MILES) and in the evolutionary tracks (Padova94 vs Parsec) - for this we consider also an intermediate step and check the difference between CB16 (Padova94) and CB19 (Parsec) both based on the MILES stellar library; ii) a library that differs from the default one in the assumed shape of the continuous SFH, namely an exponentially declining form instead of a delayed-Gaussian (’Sandage’) model; iii) a library in which the stellar metallicity is kept constant along the SFH instead of being a function of the stellar mass formed.
We find that the latest version of the SPS models CB19 tends to result in younger ages, with a larger spread towards younger ages for quiescent galaxies around log(Age/yr) = 9.5, in higher metallicities with an offset roughly constant with metallicity below log(Z/Z⊙) = 0.2, in slightly larger dust attenuations and in higher stellar masses. These differences in age and metallicity are mostly associated to the change from Stelib to MILES stellar library, with milder (or counteracting) effects associated to the evolutionary tracks, at least in the range of parameters of LEGA-C galaxies.
Assuming a delayed-Gaussian SFH instead of an exponentially declining one impacts mostly on the light-weighted age, leading to younger values for galaxies with intermediate ages log(Age/yr) = 9 − 9.5, but also leads to < 0.1 dex higher stellar metallicities. This is driven by the intrinsic shift to later epochs of the peak of the SFH. Introducing a chemical evolution history, rather than having the metallicity constant, impacts mostly the stellar metallicity estimates with a roughly constant offset of less than 0.1 dex, leaving the other parameters almost unaffected. This is understood by the fact that at fixed mass-weighted average metallicity, a SFH with increasing metallicity produces a weaker absorption index with respect to the case of a fixed metallicity. At fixed index strength, the metallicity is thus lower if interpreted with a constant metallicity.
In summary, we find an overall systematic difference in stellar metallicity of 0.28/0.34 dex for Q/SF galaxies associated in large part to the change in SPS models, followed with equal share by the change in SFH and chemical enrichment history assumptions. Comparing the fits with the new set-up with respect to the previous one, we find that the overall systematic difference in light-weighted age is −0.18/−0.13 dex for Q/SF galaxies, mostly driven by changes in SFH assumptions, followed by the change in SPS models. We notice that while the systematic differences in mass and dust attenuation are lower than their typical uncertainty and with scatter comparable to the uncertainties, the offsets in age and metallicity are comparable to or larger than their typical uncertainty. A simple comparison of the best-fit χ2 indicates that the new modelling set-up provides a better quality fits to the data (0.6/0.5 with respect to 1/0.7 on average for Q/SF galaxies). The results are summarised in Table D.1.
Systematic differences in physical parameter estimates due to different modelling assumptions within our BaStA code.
In Fig. D.1 we plot the age-mass and metallicity-mass relations obtained for the LEGA-C sample using the same model library and modelling assumptions as in our previous works, to make a direct comparison in particular with the results obtained in Gallazzi et al. (2014) with a more limited dataset in terms of number of galaxies and spectral quality. This plot shows that, under consistent assumptions, the LEGA-C dataset agrees with the results obtained in Gallazzi et al. (2014) at similar redshift. At the same time, it highlights the improved sampling of the age and stellar metallicity scaling relations thanks to the larger statistics in LEGA-C and the higher spectral quality, which allow for better coverage of the lower mass and younger galaxies. This is essential to robustly characterise the scaling relations across the transition between quiescent and star-forming galaxies and down to masses < 1010.5 M⊙. The LEGA-C sample also reveals a larger dispersion in metallicity with respect to the mean uncertainties that could not be detected in G14.
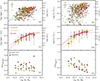 |
Fig. D.1. The age-stellar mass and stellar metallicity-stellar mass distribution of LEGA-C galaxies (silver and golden samples) as in Fig. 8, but using parameter estimates obtained with the modelling assumptions as in Gallazzi et al. (2014). These are compared with the dataset and scaling relations fit obtained in Gallazzi et al. (2014) (magenta points and curves). The error bars on the median points indicate the 84th-16th interpercentile of the distributions. The median ages and metallicities as a function of stellar mass are here fit adopting the functional form used in Gallazzi et al. (2014) (their Eq. 1) for a direct comparison. |
Appendix E: Catalogue of stellar population parameters and comparison of estimates from different methods
We release a catalogue of the stellar population parameters estimated in this work with BaStA. While we select a robust sample for the analysis of the age and stellar metallicity scaling relations, parameter estimates are provided for the whole LEGA-C DR3. Parameters include: stellar mass, r-band-light-weighted and mass-weighted mean ages and stellar metallicities, g-band dust attenuation. We provide information about the indices used in each fit, as well as flags to select silver and golden samples. Estimates from BaStA are based on duplicate-combined indices, when available. The catalogue also provides stellar populations and SFH parameters obtained from complementary spectral fitting performed within the LEGA-C team, specifically using: i) Prospector as described in Nersesian et al. (2025), which adopts Simple Stellar Populations constructed from FSPS with MILES stellar library and MIST isochrones, non-parametric SFHs and constant metallicity along the SFH (see their Table 1); and ii) BAGPIPES as described in Kaushal et al. (2024) which adopts the 2016 version of Bruzual & Charlot (2003) models with MILES stellar library, double power-law SFH and constant metallicity (see their Table 1). These estimates are obtained from the individual spectra, in combination to photometry. Parameters from these other methods include stellar metallicity (constant along the SFH), light- and mass-weighted ages, stellar mass, V-band dust attenuation and current SFR.
In order to quantify potential systematic uncertainties originating from different spectral fitting methods, we compare the results obtained with BaStA and with the SFH library adopted in this work with those obtained in Nersesian et al. (2025) and in Kaushal et al. (2024). Figure E.1 shows the 1:1 comparison between the different estimates of the main physical parameters: light-weighted stellar metallicity, light-weighted and mass-weighted age, stellar mass and dust attenuation. For this comparison, all stellar metallicities have been reported to a common solar scale of Z⊙ = 0.02. We show all silver galaxies but rely only on the golden sample for statistics, i.e. those galaxies for which we can most reliably constrain ages and stellar metallicities given the wavelength coverage and S/N of their spectra. We further distinguish galaxies into quiescent (magenta circles) and star-forming (blue stars) to highlight any systematics in the two populations. In Table E.1 we summarise the differences between the three results on the physical parameters. We report the mean and the r.m.s. of the difference between each pair and the median uncertainty on the parameters from each method. In all cases, the reference estimated value is the median of the PDF, while the uncertainty is given by half of the 84th − 16th percentile width. This comparison incorporates differences associated to the observational diagnostics used (indices+photometry as opposed to full spectrum and photometry), the prior assumptions on SFH, metallicity and dust, and the base SPS models adopted.
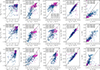 |
Fig. E.1. Comparison between parameter estimates obtained with our default BaStA code and those obtained with full-spectral fitting codes: Prospector as in Nersesian et al. (2025), and Bagpipes as in Kaushal et al. (2024). We consider only silver and golden galaxies (empty and filled symbols), distinguished into quiescent (magenta circles) and star-forming (blue stars). In each panel we report the mean difference between the two estimates and its scatter, as well as the median uncertainty from each method, for quiescent (left) and star-forming (right). The 1:1 line is also shown for guidance. Stellar metallicities have all been reported to a common scale of Z⊙ = 0.02. |
Comparison of physical parameter estimates obtained with our default BaStA run with those obtained with Bagpipes (Kaushal et al. 2024) and Prospector (Nersesian et al. 2025).
We notice that stellar metallicity is the parameter on which there is poorer agreement. Quiescent galaxies span the high-metallicity end in all cases, while we see a larger scatter in the stellar metallicity estimates of star-forming galaxies, in accordance with their larger uncertainties. Notice that the models adopted in this work extend over a larger range in metallicity than those used with Bagpipes and Prospector. Moreover while the metallicities estimated with BaStA are light-weighted averages, Bagpipes and Prospector assume a constant stellar metallicity along the SFH. The scatter in the different estimates is ∼0.2 dex and ∼0.4 dex for quiescent and star-forming galaxies, respectively. This is significantly larger than the nominal uncertainties estimated with Bagpipes and Prospector, but closer to the uncertainty from BaStA (0.16 dex and 0.25 dex).
The luminosity-weighted ages of quiescent galaxies from BaStA and from Prospector correlate with each other but with a systematic offset of 0.08 dex, in the sense of older ages from Prospector. The comparison with Bagpipes is hampered by the fact that the majority of golden quiescent galaxies are assigned a light-weighted age that cluster around log(Age/yr)∼9.5, a feature noticed also in Kaushal et al. (2024). The age estimates for star-forming galaxies are in better agreement between the three methods considered. The overall scatter in the age differences is comparable to the combined uncertainties for BaStA and Prospector or Bagpipes. Likewise for metallicity, the uncertainties from Prospector or Bagpipes however underestimate the scatter between the two age estimates.
The comparison of mass-weighted ages shows in general larger scatter, as a consequence of the typically larger uncertainties and the stronger dependence on the assumed SFHs. We notice that Prospector mass-weighted ages, that rely on non-parametric SFHs, are significantly older than those from BaStA or Bagpipes (see also the discussion in Kaushal et al. 2024). We also find that mass-weighted ages compare to light-weighted ages in a similar way in the three methods considered (see Sec. 4.3). We find quantitatively more similar trends with BAGPIPES, while the mass-weighted ages from Prospector are systematically and significantly older, deviating more and more from the light-weighted ages for younger galaxies (see discussion in Kaushal et al. 2024).
Stellar mass estimates correlate well with each other for both quiescent and star-forming galaxies, although Bagpipes masses of quiescent galaxies tend to be smaller than both BaStA and Prospector. The scatter is typically comparable or slightly larger than the uncertainties estimated from BaStA. We notice a large scatter in the comparison with Prospector driven by few galaxies for which significantly low masses are estimated.
Finally, the three methods agree in assigning small dust attenuation for quiescent galaxies below 0.5 mag, but with a tail to larger values for BaStA and Bagpipes. Star-forming galaxies span a larger range in dust attenuation, reaching higher values for BaStA and Bagpipes, which agree well with each other with a scatter consistent with the uncertainties.
It is worth noticing that in general the formal uncertainties associated to both Bagpipes and Prospector are significantly smaller than those estimated with BaStA and than the scatter in the parameter estimates. The uncertainties quantified with BaStA typically account for more than 60% of the scatter between estimates from different methods, compared to ∼10% from Prospector or Bagpipes. We thus considered the uncertainties from BaStA, which we verified to be well calibrated and consistent with the scatter between input and retrieved parameters from mock spectra (Rossi 2025), to be more representative of the underlying degeneracies.
One may wonder how much the scatter between these different estimates on an individual galaxy basis impact on the median scaling relations. Fig. E.2 compares the median trends of age and metallicity versus stellar mass and velocity dispersion obtained with the three different estimates. We find the median relations, for the golden sample, to agree significantly better than the 1:1 comparison would suggest. In particular, the median light-weighted age as a function of stellar mass or velocity dispersion follows a similar sigmoidal behaviour, with a young and an old regime, with all three codes. Prospector however results in a steeper decrease in age at lower masses or velocity dispersion. BaStA and Bagpipes deliver consistent stellar metallicity scaling relations, while Prospector results in a flatter relation. We stress that these differences include differences in spectral modelling as well as in observational diagnostics. In particular, our approach with BaStA gives more weight to metal-sensitive features than full spectral fitting approaches do.
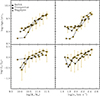 |
Fig. E.2. Median age–mass and metallicity–mass relations for the golden sample, as obtained in this work (squares) compared to those obtained with Prospector (circles) or Bagpipes (stars) parameter estimates. Ages are light-weighted average in all cases, stellar metallicities are light-weighted in BaStA and constant along the SFH in the other cases. For readability, the dispersion in the distribution, indicated by the error bars, is shown only for BaStA estimates. Stellar metallicities have all been reported to a common scale of Z⊙ = 0.02. |
For completeness, in Fig. E.3 we also show the comparison between our estimates and those from the other published catalogue of stellar population parameters for the whole LEGA-C DR3 by Cappellari (2023) based on full spectral fitting with pPXF (see Nersesian et al. 2025, for a similar comparison with Prospector results). We notice that pPXF retrieves systematically older ages for the quiescent galaxies (exceeding the Universe’ age at the LEGA-C redshift) and significantly younger ages for the star-forming galaxies. Stellar metallicities are systematically lower, partly because of the smaller range in the adopted SPS models, and show a larger separation between quiescent and star-forming galaxies than our estimates. Notice that for both age and metallicity Cappellari (2023) adopts a different definition, computing the average log age and log metallicity rather than averaging the linear quantities. This gives significantly more weight to lower ages and metallicities and it explains to a large extent the disagreement. While stellar masses correlate well, there is a systematic offset especially for quiescent galaxies. Dust attenuations are also systematically lower than ours, especially for star-forming galaxies.
 |
Fig. E.3. Comparison between parameter estimates obtained in this work with those obtained with pPXF and the FSPS population synthesis code published in Cappellari (2023). We consider only galaxies in the silver and golden samples (empty and filled symbols respectively) distinguished into Q and SF (magenta circles and blue stars, respectively). The mean difference between BaStA and pPXF estimates, the rms scatter and the mean uncertainties on BaStA estimates (those from pPXF are not provided) are reported in each panel for quiescent (left) and star-forming (right). Stellar metallicities have been reported to a common Z⊙ = 0.02 scale, and our stellar masses have been rescaled up by 1.75 to match the Salpeter IMF used by Cappellari (2023). |
All Tables
Summary table of the parameters used to generate the composite stellar populations library.
Samples used in the scientific analysis and mean uncertainties on the physical parameter estimates.
Systematic differences in physical parameter estimates due to different modelling assumptions within our BaStA code.
Comparison of physical parameter estimates obtained with our default BaStA run with those obtained with Bagpipes (Kaushal et al. 2024) and Prospector (Nersesian et al. 2025).
All Figures
|
Fig. 1. Distribution in stellar mass and redshift for the LEGA-C primary sample (grey dots and dot-dashed histograms, normalised to unit integral) and for the sub-samples used in the analysis. The sub-samples are the silver sample (grey symbols and histograms) and the golden sample (golden symbols and histograms). The histograms for the silver and golden samples have been normalised by the number of galaxies in the silver sample. The number of galaxies in each sub-sample is given in parenthesis. Redshifts come from the LEGA-C DR3 catalogue, while stellar masses are those computed in this work. |
| In the text | |
|
Fig. 2. Distribution in specific SFR versus stellar mass (left panel) and in U-V, V-J rest-frame colours (right panel). We separated the galaxies into quiescent (Q, magenta circles) and star-forming (SF, blue stars) based on their location with respect to the star forming main sequence (SFMS; solid line in the left panel). The Q galaxies are those deviating by more than 2σ below the SFMS (i.e. they lie below the dashed line in the left panel). The right-hand panel illustrates how this selection compares with the UVJ quiescent zone outlined by the dashed segment (Muzzin et al. 2013b). Empty (filled) symbols indicate galaxies in the silver (golden) samples. The numbers in the left panel give the number of SF and Q galaxies in the golden, silver and parent LEGA-C samples. All quantities in this plot come from the LEGA-C DR3 catalogue, except stellar masses which are those computed in this work. |
| In the text | |
|
Fig. 3. Distribution in diagnostic diagrams of the absorption indices showing the combinations of indices considered in this work for their different sensitivity to age and metallicity. The coloured region shows the distribution of the adopted model library of complex star formation and metal enrichment histories (see Sect. 3.1), colour-coded for r-band light-weighted age (left-most panels) and for r-band light-weighted stellar metallicity. Symbols are as in Fig. 2: galaxies are distinguished into quiescent (magenta) and star-forming (blue) based on a mass-dependent threshold in specific SFR; empty symbols indicate galaxies belonging to the silver sample, i.e. with optimal combinations of indices, while filled symbols refer to the golden sub-sample (with S/N > 20); dots display all the galaxies in the LEGA-C sample with measurements of the two indices in each panel. In each panel only galaxies for which the corresponding couple of indices has been used in the fit are shown (therefore all the galaxies shown lie within 3σ of the model region). In each panel we report the number of galaxies shown among those in the full LEGA-C, silver or golden samples. The error bars display the median uncertainty on each index for the golden (thick black) and the silver galaxies (thin grey). |
| In the text | |
|
Fig. 4. Comparison between observed and best-fit predicted index strengths for the absorption features considered in the BaStA fit as age-sensitive diagnostics. Left panels: Best-fit versus observed index strength. Grey filled circles show the full primary LEGA-C catalogue for which the index is measured; black circles highlight galaxies in the silver sample; magenta (blue) circles highlight quiescent (star-forming) galaxies in the golden sample. Filled symbols indicate galaxies for which the index has been used in the fit. The thin and thick error bars indicate the median observational error for silver and golden galaxies respectively. The median offset, rms scatter and the median uncertainty are reported in each panel for the silver sample. Right panels: distribution of the difference between the absorption index strength predicted by the best-fit model and the observed one, normalised by the observational error (regardless of whether the index was used in the fit). Grey histograms are for the whole LEGA-C sample (normalised to unit area); black, magenta, blue histograms refer to the silver, golden Q, golden SF respectively (normalised to the silver sample). A Gaussian centred on zero and with unit standard deviation is shown for reference (dot-dashed curve). |
| In the text | |
|
Fig. 5. Same as Fig. 4 but for the absorption features considered in the BaStA fit as metallicity-sensitive diagnostics. |
| In the text | |
|
Fig. 6. Distribution in r-band light-weighted mean age (upper-left), r-band light-weighted mean stellar metallicity (upper-right), stellar mass (lower-left), and dust attenuation in the g-band (lower-right) for the LEGA-C silver and golden samples analysed in this work. For each parameter, the upper panel displays the distribution in the estimated parameter value (the median of the PDF). Magenta (blue) histograms show the distribution for the Q (SF) galaxies in the silver (hollow) and in the golden (hatched) sub-samples, both normalised to the total silver sample. Grey dot-dashed histograms (normalised to unit integral) display the whole LEGA-C parent sample regardless of the indices used in the fit. The lower panel shows the uncertainties (half of the 84–16 percentile range) in the parameter estimates against the fiducial values. Galaxies belonging to the silver sample are distinguished into Q (magenta circles) and SF (blue stars), with filled symbols highlighting galaxies in the golden sub-sample. |
| In the text | |
|
Fig. 7. Comparison between light-weighted and mass-weighted ages and stellar metallicities derived in this work for golden galaxies. Magenta circles indicate Q galaxies, blue stars indicate SF galaxies. The error bars show the median uncertainties for the two sub-samples. The upper panels show the 1:1 comparison, while the bottom panels show the difference between light- and mass-weighted quantities versus stellar mass. |
| In the text | |
|
Fig. 8. Luminosity-weighted age (left panels) and luminosity-weighted stellar metallicity (right panels) versus stellar mass for LEGA-C galaxies. The upper panels show individual measurements. The silver sample is shown with silver circles and golden galaxies are highlighted with golden circles. Middle panels show the median age (panel c) and median stellar metallicity (d) in bins of stellar mass 0.2 dex wide and with at least five galaxies. Thick vertical error bars show the error on the median, while thin horizontal and vertical bars indicate the 16th–84th interpercentile range of the distribution. Silver filled squares refer to the silver sample weighted for completeness with Tcor × w_spec_silver, while golden filled (empty) squares refer to the golden sample without (with) weights. The corresponding lines in panel c (d) display the relation as in Eq. (1) that best fits the median values of age (metallicity) for the weighted silver and weighted golden sample respectively. The bottom panels compare the mean error on individual age and stellar metallicity estimates (crosses) with the dispersion, as given by the 16th–84th interpercentile range, at fixed stellar mass (hexagons), with silver (golden) symbols for silver (golden) sample. |
| In the text | |
|
Fig. 9. Luminosity-weighted age (left panels) and luminosity-weighted stellar metallicity (right panels) versus stellar velocity dispersion for LEGA-C galaxies. Symbols and colours have the same meaning as in Fig. 8. The lines in panel c show the bestfit age–σ* relation using Eq. (1), while those in panel d show the bestfit linear log Z* − log σ* relation using Eq. (2). |
| In the text | |
|
Fig. 10. Stellar mass–velocity dispersion plane colour-coded by light-weighted age (left) and light-weighted stellar metallicity (right). For visualisation purposes, the age and metallicity have been LOESS-smoothed. Vectors in the bottom right corner are proportional to the partial correlation coefficients, computed for the original (non-smoothed) physical parameters, following Scholz-Díaz et al. (2022, 2024). The red line marks the direction of maximal increase in age/metallicity. The grey vectors refer to a correlation coefficient of 0.5 for comparison. |
| In the text | |
|
Fig. A.1. Resolving power of the absorption indices used in this work. The resolving power is defined as the index dynamic range of the observed sample divided by the observational error on each index measure. The solid black histograms include all the galaxies with a valid measurement of the given absorption index among the 2588 unique galaxies in the LEGA-C primary sample with a measurement of stellar velocity dispersion. Each histogram is normalised by the total number of galaxies used, N, which is reported in each panel. The dark and light grey hatched histograms refer to the Q and SF LEGA-C galaxies, respectively. The golden histograms refer to the golden sub-sample used in this work. All these histograms are normalised by N. The distributions for LEGA-C galaxies are compared, when available, to those of SDSS DR7 (blue) and of G14 (magenta) samples, each normalised by their total number of galaxies. |
| In the text | |
|
Fig. B.1. Comparison of light-weighted ages (left) and light-weighted stellar metallicities (right) obtained for individual duplicate observations (y-axis; duplicate measurements for each galaxy are connected with a dashed line) with those obtained from the duplicate-combined indices (x-axis). Filled symbols refer to those galaxies whose fit is constrained by the full set of five optimal indices (D4000n, Hβ, HδA+HγA, [Mg2Fe], [MgFe]′) when duplicate observations are combined. The error bars indicate the mean uncertainties in each estimate, with the thicker error bars referring to estimates based on the five optimal indices. |
| In the text | |
|
Fig. C.1. Comparison between estimated dust attenuation and expectations based on spectro-photometric diagnostics. Left-hand figure: Distribution in rest-frame U-V, V-J colour for our sample galaxies. Filled (empty) symbols refer to the golden (silver) sample, while circles and stars distinguish Q and SF galaxies. The colour-coding indicates the dust attenuation Ag estimated from BaStA fitting of spectral indices and rizYJ photometry. Right-hand figure: distribution in 4000Å-break versus J − 24 μm colour (upper panel) and in estimated dust attenuation Ag versus J − 24 μm colour (lower-left panel) or versus stellar mass (lower-right panel). |
| In the text | |
|
Fig. D.1. The age-stellar mass and stellar metallicity-stellar mass distribution of LEGA-C galaxies (silver and golden samples) as in Fig. 8, but using parameter estimates obtained with the modelling assumptions as in Gallazzi et al. (2014). These are compared with the dataset and scaling relations fit obtained in Gallazzi et al. (2014) (magenta points and curves). The error bars on the median points indicate the 84th-16th interpercentile of the distributions. The median ages and metallicities as a function of stellar mass are here fit adopting the functional form used in Gallazzi et al. (2014) (their Eq. 1) for a direct comparison. |
| In the text | |
|
Fig. E.1. Comparison between parameter estimates obtained with our default BaStA code and those obtained with full-spectral fitting codes: Prospector as in Nersesian et al. (2025), and Bagpipes as in Kaushal et al. (2024). We consider only silver and golden galaxies (empty and filled symbols), distinguished into quiescent (magenta circles) and star-forming (blue stars). In each panel we report the mean difference between the two estimates and its scatter, as well as the median uncertainty from each method, for quiescent (left) and star-forming (right). The 1:1 line is also shown for guidance. Stellar metallicities have all been reported to a common scale of Z⊙ = 0.02. |
| In the text | |
|
Fig. E.2. Median age–mass and metallicity–mass relations for the golden sample, as obtained in this work (squares) compared to those obtained with Prospector (circles) or Bagpipes (stars) parameter estimates. Ages are light-weighted average in all cases, stellar metallicities are light-weighted in BaStA and constant along the SFH in the other cases. For readability, the dispersion in the distribution, indicated by the error bars, is shown only for BaStA estimates. Stellar metallicities have all been reported to a common scale of Z⊙ = 0.02. |
| In the text | |
|
Fig. E.3. Comparison between parameter estimates obtained in this work with those obtained with pPXF and the FSPS population synthesis code published in Cappellari (2023). We consider only galaxies in the silver and golden samples (empty and filled symbols respectively) distinguished into Q and SF (magenta circles and blue stars, respectively). The mean difference between BaStA and pPXF estimates, the rms scatter and the mean uncertainties on BaStA estimates (those from pPXF are not provided) are reported in each panel for quiescent (left) and star-forming (right). Stellar metallicities have been reported to a common Z⊙ = 0.02 scale, and our stellar masses have been rescaled up by 1.75 to match the Salpeter IMF used by Cappellari (2023). |
| In the text | |
Current usage metrics show cumulative count of Article Views (full-text article views including HTML views, PDF and ePub downloads, according to the available data) and Abstracts Views on Vision4Press platform.
Data correspond to usage on the plateform after 2015. The current usage metrics is available 48-96 hours after online publication and is updated daily on week days.
Initial download of the metrics may take a while.