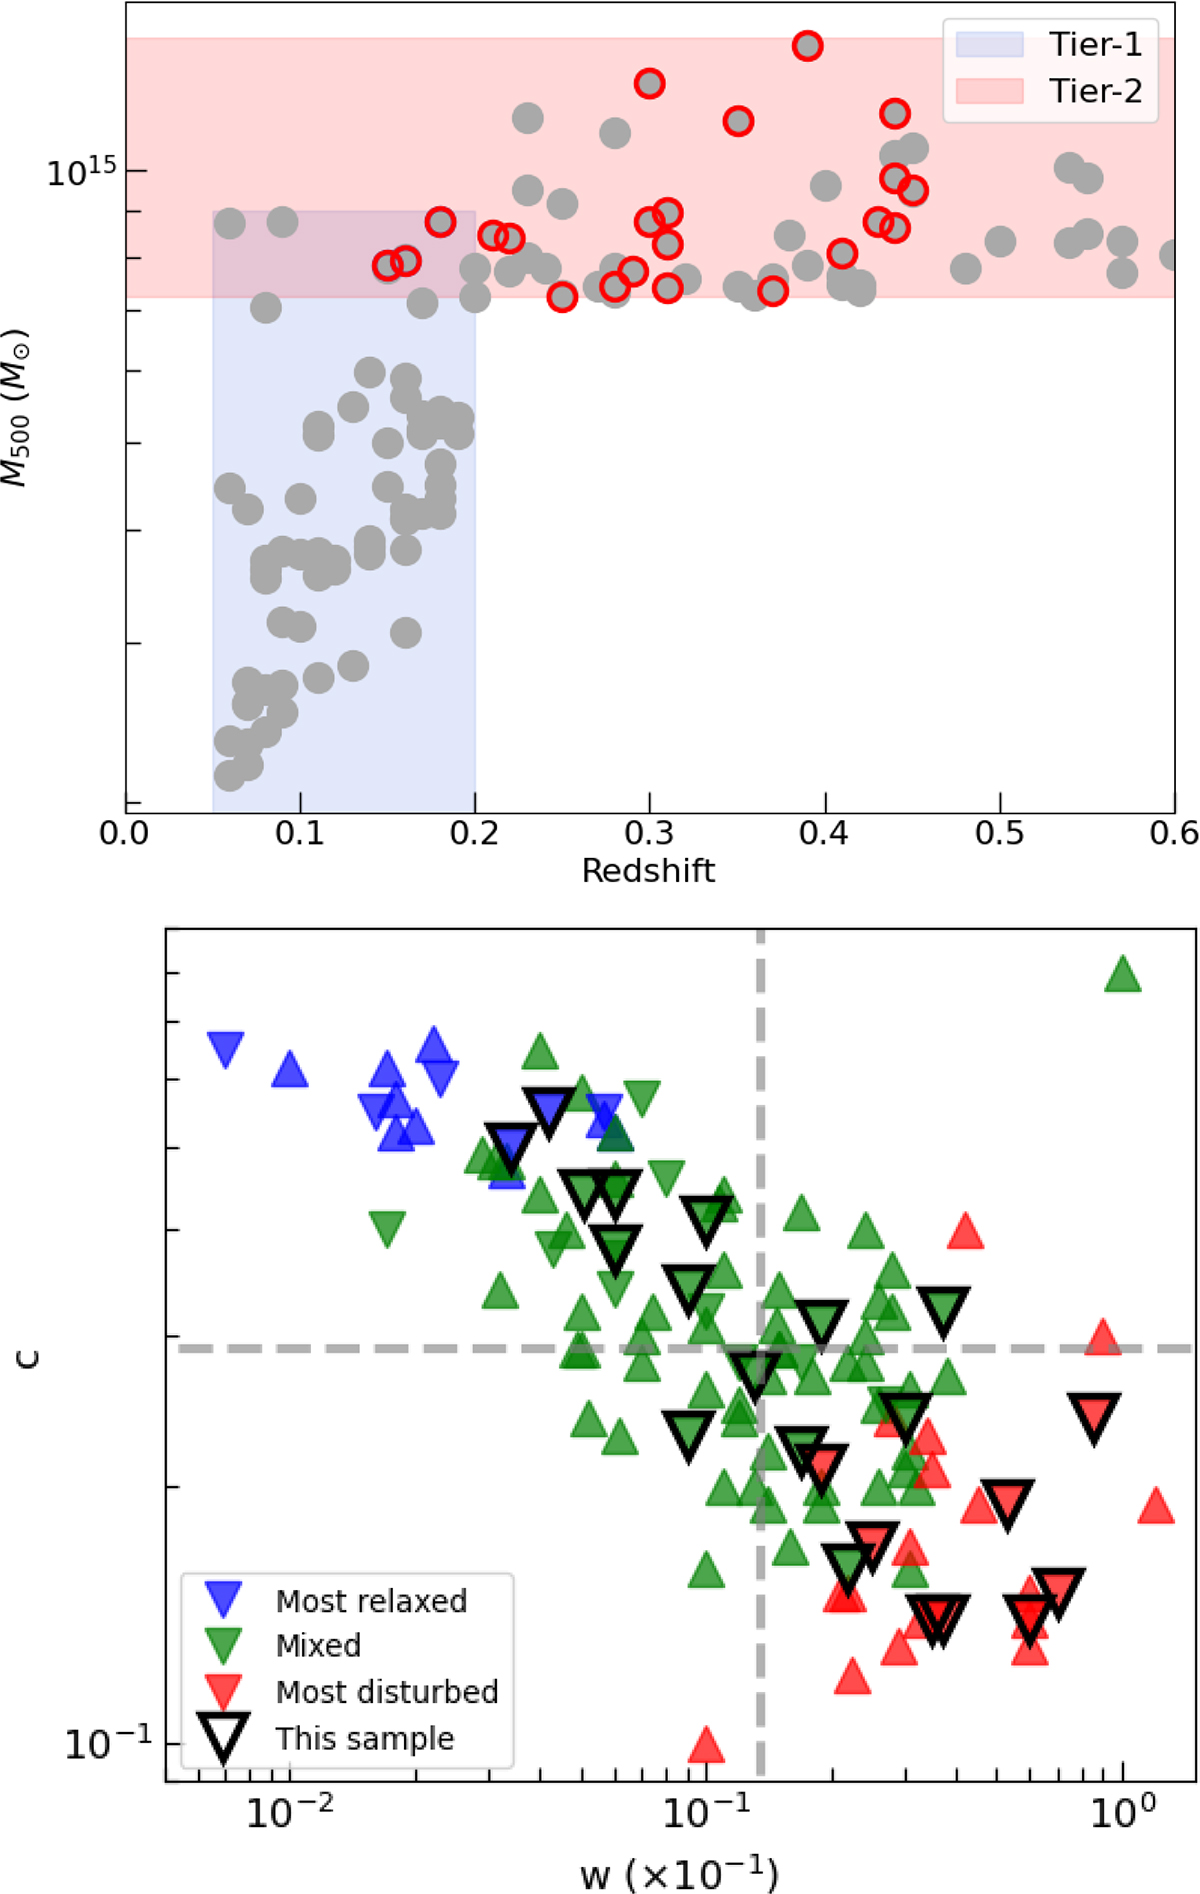
Fig. 1.
Download original image
Visual comparison of the whole CHEX-MATE sample and the studied cluster sample. Top: Mass-redshift distribution of the CHEX-MATE clusters (grey) with highlighted in red the targets considered in this work, alongside Tier-1 (0.05 < z < 0.2; M500 > 2 × 10¹⁴ M⊙) and Tier-2 (z < 0.6; M500 > 7.25 × 10¹⁴ M⊙) sub-samples. Bottom: Same comparison as the top panel, but for the c − w plane. The dynamical classification is taken from C22, with up (down) triangles indicating objects with δ > 0° (< 0°), while the two dashed lines are the median value of the c and w parameters of CHEX-MATE.
Current usage metrics show cumulative count of Article Views (full-text article views including HTML views, PDF and ePub downloads, according to the available data) and Abstracts Views on Vision4Press platform.
Data correspond to usage on the plateform after 2015. The current usage metrics is available 48-96 hours after online publication and is updated daily on week days.
Initial download of the metrics may take a while.