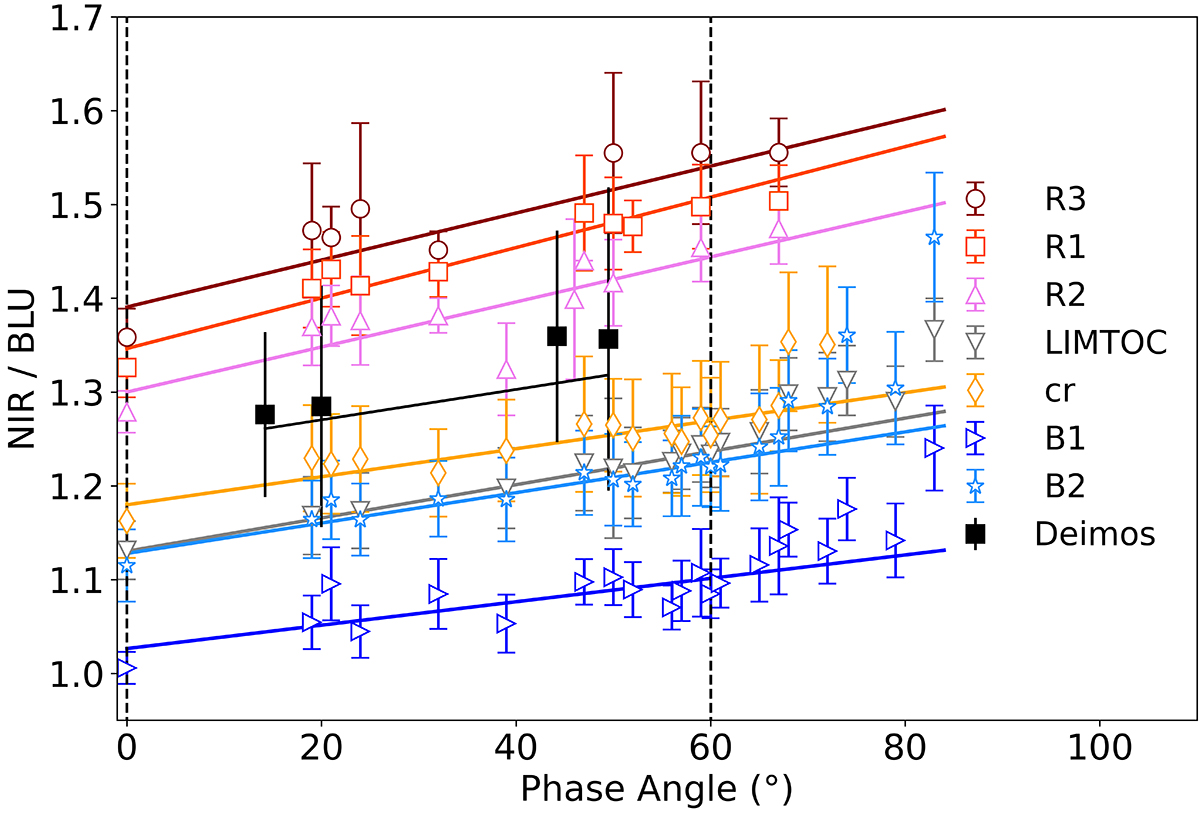
Fig. 3.
Download original image
NIR/BLU vs. phase-angle data for the Phobos ROIs and Deimos. The error bars are the 1σ standard deviations. The solid line shows the best-fit linear phase-reddening models, whose parameters are reported in Table 1. The vertical dashed lines indicate the range of the phase angles we used for the fits. The ROIs are defined in Fig. 2 and are described in Sect. 2.
Current usage metrics show cumulative count of Article Views (full-text article views including HTML views, PDF and ePub downloads, according to the available data) and Abstracts Views on Vision4Press platform.
Data correspond to usage on the plateform after 2015. The current usage metrics is available 48-96 hours after online publication and is updated daily on week days.
Initial download of the metrics may take a while.