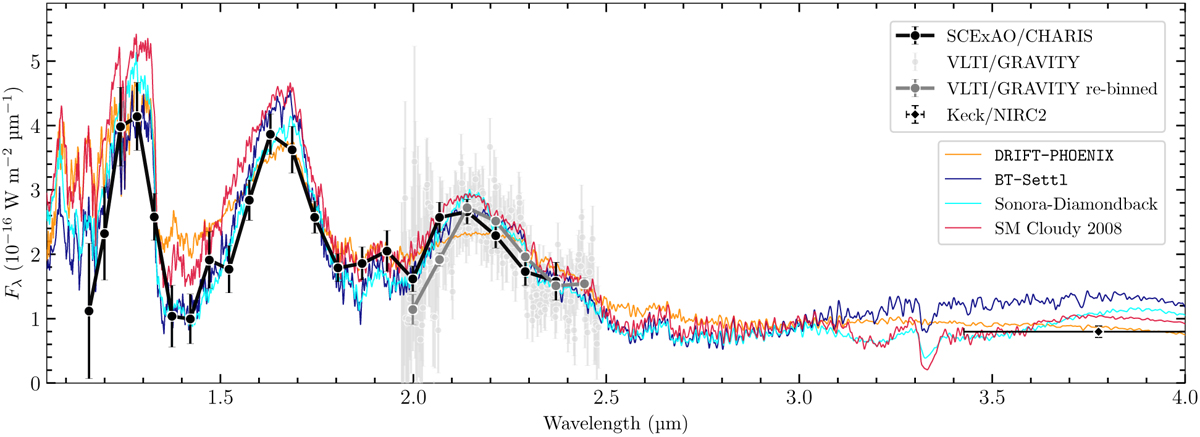
Fig. 8
Download original image
Spectral energy distribution of HIP 99770 b. The black points encircled by a white border and connected by a black line show the CHARIS spectrum taken from Currie et al. (2023). The light grey points depict the combination of the on- and off-axis GRAVITY spectra. For visualisation purposes, a rebinned lower resolution GRAVITY spectrum is shown in dark grey encircled by a white border and connected by a dark grey line. Additionally, the mid-infrared photometry data point in the NIRC2.Lp filter is shown as a black diamond encircled by a white border (Currie et al. 2023). The associated horizontal error bar indicates the FWHM of the filter transmission profile. The spectra resulting from the most likely parameter sets determined by the posterior sampling processes are shown for four different atmospheric forward models. SM Cloudy 2008 denotes the cloudy (fsed = 2) Saumon & Marley (2008) model.
Current usage metrics show cumulative count of Article Views (full-text article views including HTML views, PDF and ePub downloads, according to the available data) and Abstracts Views on Vision4Press platform.
Data correspond to usage on the plateform after 2015. The current usage metrics is available 48-96 hours after online publication and is updated daily on week days.
Initial download of the metrics may take a while.