Fig. D.1
Download original image
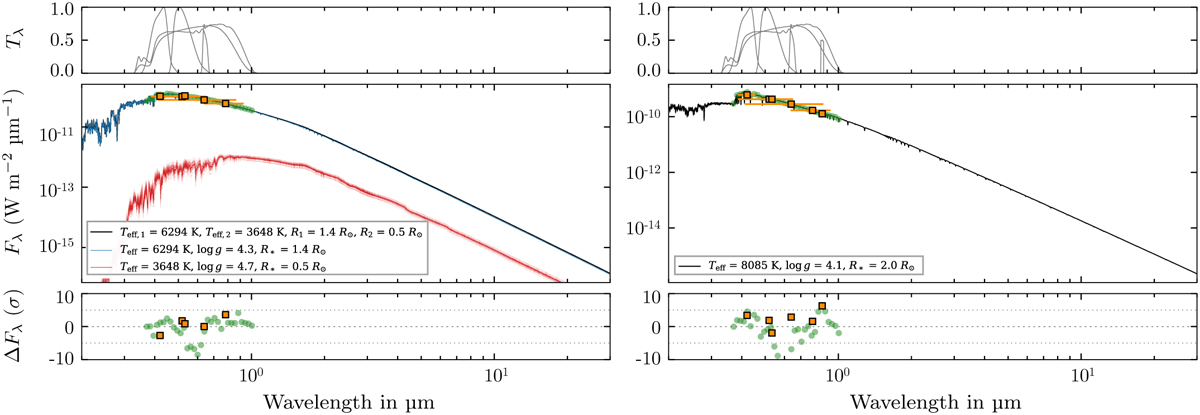
Inferred stellar model atmospheres for HIP 99770 A (left) and HD 196885 AB (right). The inferred model atmospheres for the A and B components are shown in blue and red, respectively. The combined model is shown in black. The thin lines illustrate 30 randomly drawn samples from the posterior distribution. The photometry and the Gaia XP spectrum included in the fit are shown in orange and green. For greater clarity, only every 10th data point of the Gaia XP spectrum is shown. The top panel shows the filter transmission curve for each photometric point while the bottom panel presents the residuals between the data and the best fit model atmosphere.
Current usage metrics show cumulative count of Article Views (full-text article views including HTML views, PDF and ePub downloads, according to the available data) and Abstracts Views on Vision4Press platform.
Data correspond to usage on the plateform after 2015. The current usage metrics is available 48-96 hours after online publication and is updated daily on week days.
Initial download of the metrics may take a while.