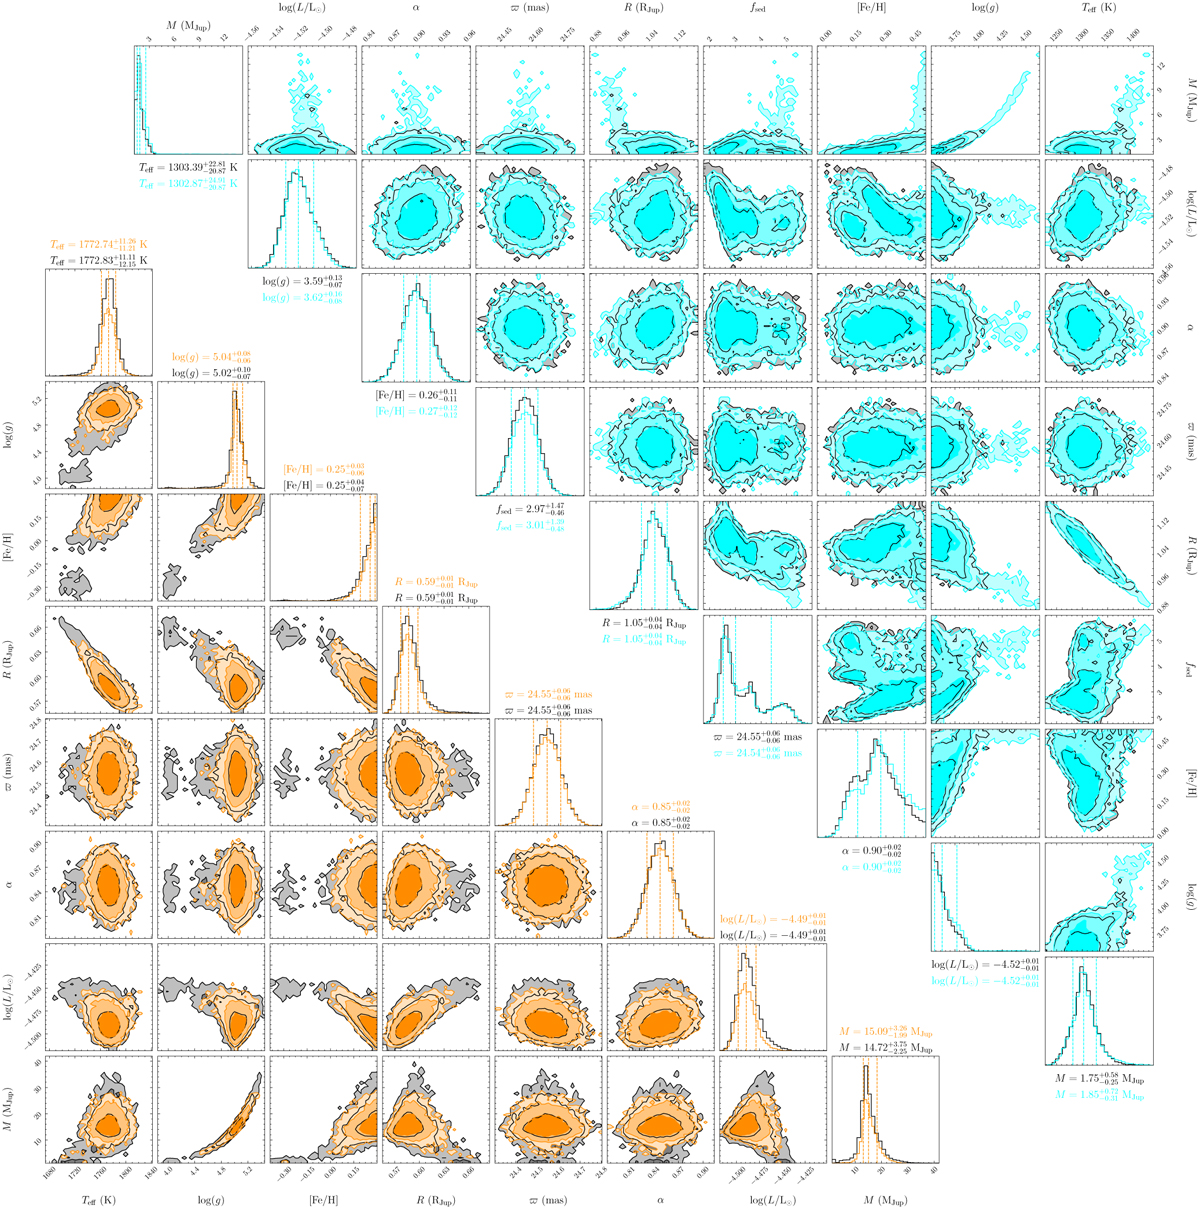
Fig. B.1
Download original image
Lower left: Corner plot showing the posterior sampling of the parameter grid when applying the DRIFT-PHOENIX model to the full set spectroscopic and photometric data presented in Sect 2. Two sampling runs were performed: the results obtained when using no mass prior, that is an uninformative uniform prior, and when using a Gaussian prior based on the dynamical mass obtained from the orbital fit (see Sect. 3) are shown in black and orange, respectively. Above the panels showing the marginalised posterior distributions we report their median values and their differences to the 84th and 16th percentiles in superscript and subscript, respectively. Upper right: Same as lower left for the Sonora Diamondback model grid.
Current usage metrics show cumulative count of Article Views (full-text article views including HTML views, PDF and ePub downloads, according to the available data) and Abstracts Views on Vision4Press platform.
Data correspond to usage on the plateform after 2015. The current usage metrics is available 48-96 hours after online publication and is updated daily on week days.
Initial download of the metrics may take a while.