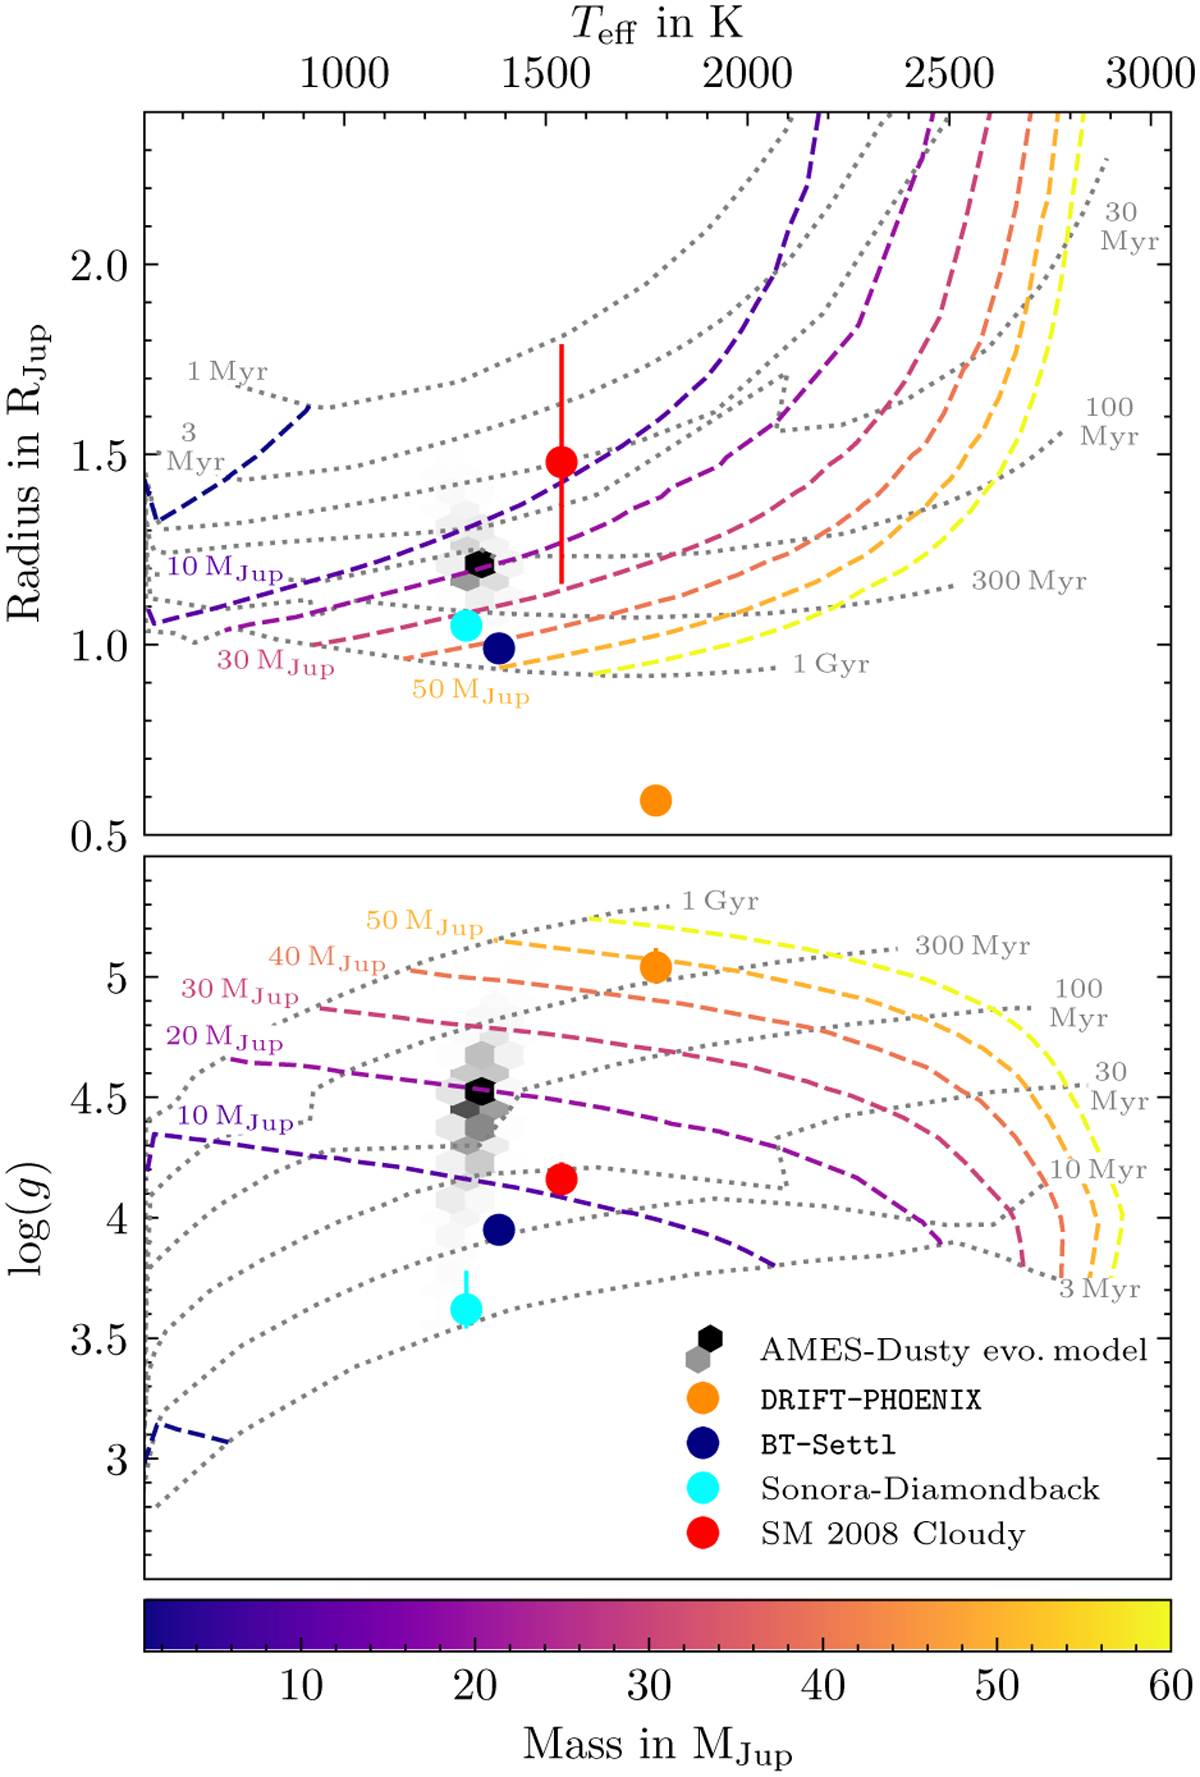
Fig. 10
Download original image
Companion radius, R, and surface gravity, log(g), as a function of effective temperature, Teff. The dotted grey lines indicate isochrones of different ages, the dashed lines illustrate evolutionary tracks, i.e. how a companion of a certain mass evolves over time. The specific masses that the tracks correspond to are indicated by their respective colours. Both the isochrones and the evolutionary tracks are taken from the AMES-Dusty model grid (Chabrier et al. 2000; Allard et al. 2001). The hexagonal bin map in the background shows where a sample of pairs drawn from the mass and K-band magnitude distributions falls when propagated into the parameter planes depicted in the two respective panels using AMES-Dusty. Finally, the values obtained through the atmospheric models applied to the spectral energy distribution of the companion are marked as circles of different colours.
Current usage metrics show cumulative count of Article Views (full-text article views including HTML views, PDF and ePub downloads, according to the available data) and Abstracts Views on Vision4Press platform.
Data correspond to usage on the plateform after 2015. The current usage metrics is available 48-96 hours after online publication and is updated daily on week days.
Initial download of the metrics may take a while.