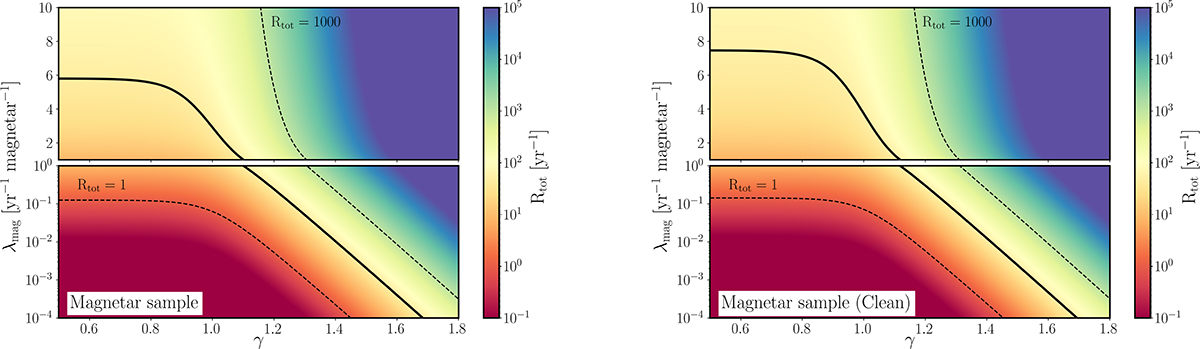
Fig. 4.
Download original image
Graphical representation of the power-law energy distribution model for both the entire sample of targets (left) and excluding the magnetar candidate SGR 2013+34 (right). The x-axis represents the slope of the power-law energy distribution γ, while on the y-axis are the number of events with an energy greater than the energy emitted by the FRB-like event of SGR J1935+2154 λmag. The two free parameters of the model are γ and λmag, and their combinations produce ℛtot (Eq. 8) for the entire magnetar sample, respectively. The rate of events obtained in every case are shown using a fixed logarithmic color code presented in the color bars. The solid black lines represent the upper limits obtained with our observing campaign on the possible combinations of γ and λmag, while the black dashed lines show reference values for graphical purposes. The difference between the upper and lower panels is the scale of the y-axis: The upper panels are in linear scale, and the lower panels are in logarithmic scale.
Current usage metrics show cumulative count of Article Views (full-text article views including HTML views, PDF and ePub downloads, according to the available data) and Abstracts Views on Vision4Press platform.
Data correspond to usage on the plateform after 2015. The current usage metrics is available 48-96 hours after online publication and is updated daily on week days.
Initial download of the metrics may take a while.