Fig. 1.
Download original image
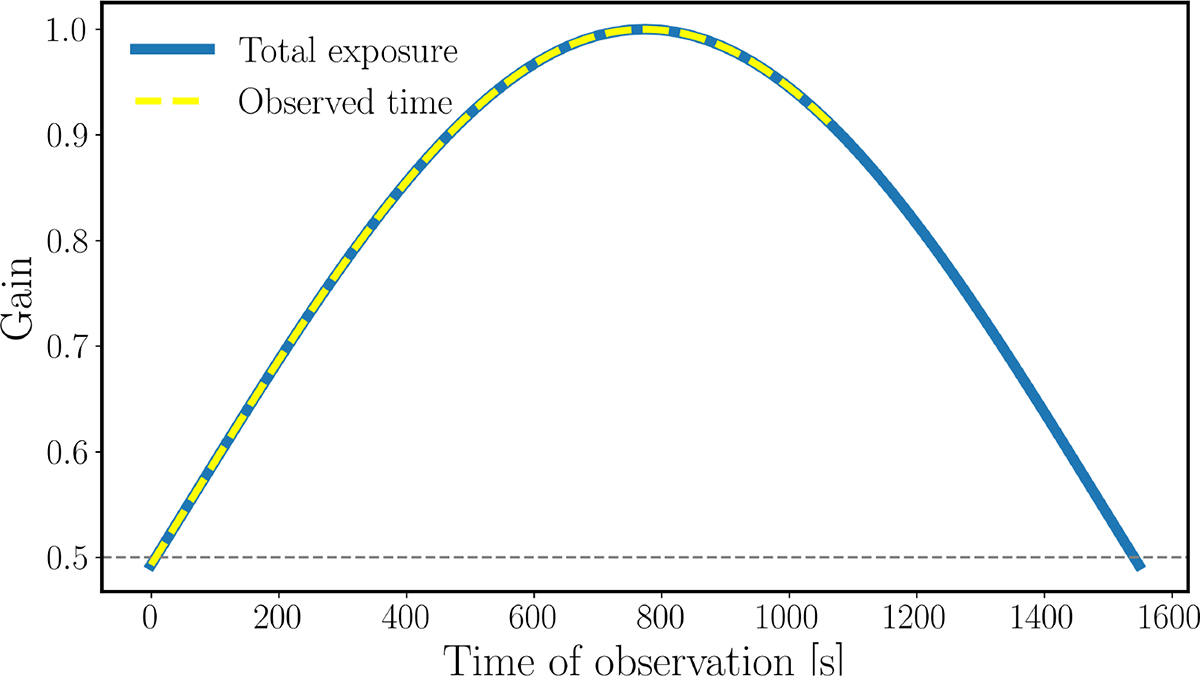
Gain profile of an NC observation on 3XMM J185246.6+003317 as an example. The target has a total exposure of 1548 s every day. The exposure is defined as the amount of time per day during which the NC can observe the target with a gain ≳0.5 (the gray dashed line represents this limit). The plot shows in blue the NC gain profile, which corresponds to the primary beam attenuation, over the entire observable interval, while the dashed yellow line represents the net observed window that, for this target, is stopped at 480 s in advance due to schedule constraints.
Current usage metrics show cumulative count of Article Views (full-text article views including HTML views, PDF and ePub downloads, according to the available data) and Abstracts Views on Vision4Press platform.
Data correspond to usage on the plateform after 2015. The current usage metrics is available 48-96 hours after online publication and is updated daily on week days.
Initial download of the metrics may take a while.