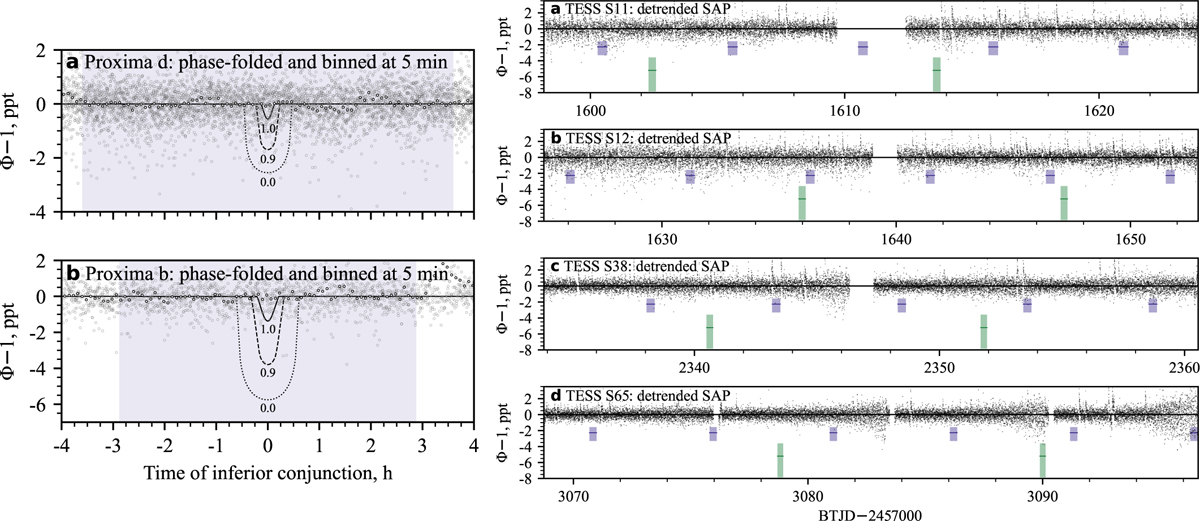
Fig. H.1
Download original image
Phase-folded TESS data. Left panel shows the detrended SAP photometry folded with the periods, and ephemerides, of Proxima d (top panel), and Proxima b (bottom panel), with the expected transit signatures for different impact parameters. The shaded region shows the uncertainty in the ephemeris. Right panel shows the TESS SAP flux of the four available sectors, with the dates and predicted depths of the potential transiting events highlighted. The green horizontal lines, and shaded regions, mark the potential transits of Proxima b. The lilac lines, and shaded regions, mark the confidence interval of the potential transits of Proxima d.
Current usage metrics show cumulative count of Article Views (full-text article views including HTML views, PDF and ePub downloads, according to the available data) and Abstracts Views on Vision4Press platform.
Data correspond to usage on the plateform after 2015. The current usage metrics is available 48-96 hours after online publication and is updated daily on week days.
Initial download of the metrics may take a while.