Fig. 22
Download original image
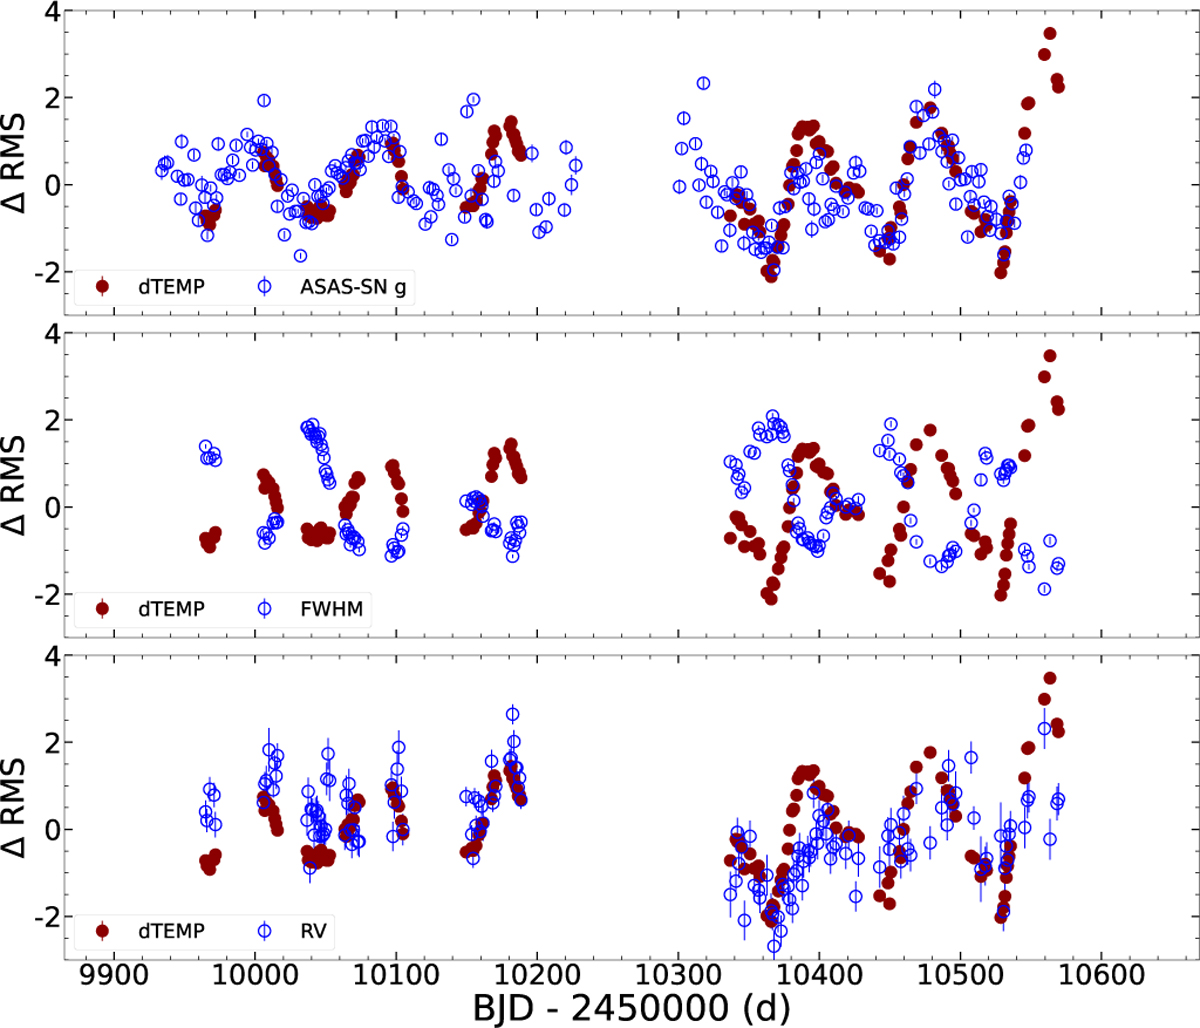
Scaled dTEMP variations, compared to other activity proxies. The top panel shows the variations of the dTEMP compared to the variations in photometric flux. The middle panel shows the variations of the dTEMP compared to the variations in the FWHM. The bottom panel shows the variations of the dTEMP compared to the variations in the RV. All data and errors are scaled to the respective RMS of the displayed time series.
Current usage metrics show cumulative count of Article Views (full-text article views including HTML views, PDF and ePub downloads, according to the available data) and Abstracts Views on Vision4Press platform.
Data correspond to usage on the plateform after 2015. The current usage metrics is available 48-96 hours after online publication and is updated daily on week days.
Initial download of the metrics may take a while.