Open Access
Fig. 20
Download original image
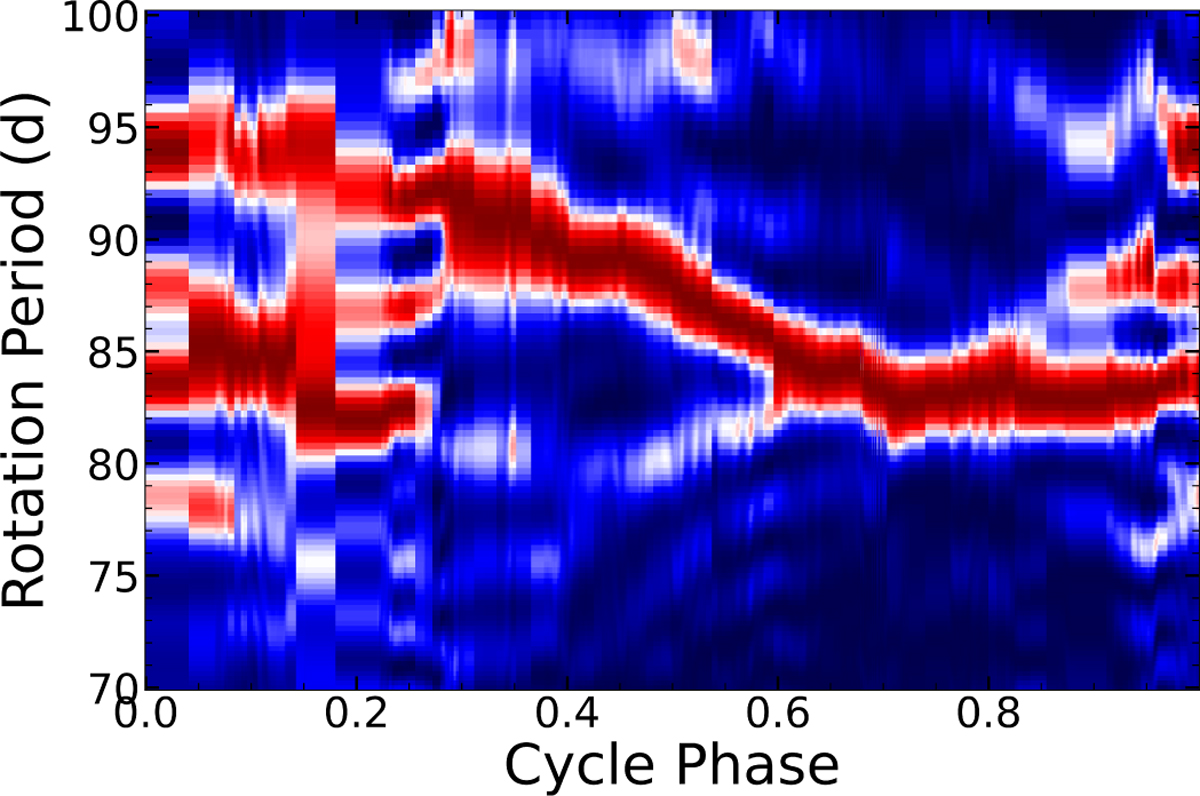
Evolution of differential rotation. Colour map of the evolution of the periodogram power at different periods as a function of the cycle phase. The red shaded regions corresponds to the periods of high periodogram power. The blue shaded regions to the regions of low periodogram power.
Current usage metrics show cumulative count of Article Views (full-text article views including HTML views, PDF and ePub downloads, according to the available data) and Abstracts Views on Vision4Press platform.
Data correspond to usage on the plateform after 2015. The current usage metrics is available 48-96 hours after online publication and is updated daily on week days.
Initial download of the metrics may take a while.