Open Access
Fig. 17
Download original image
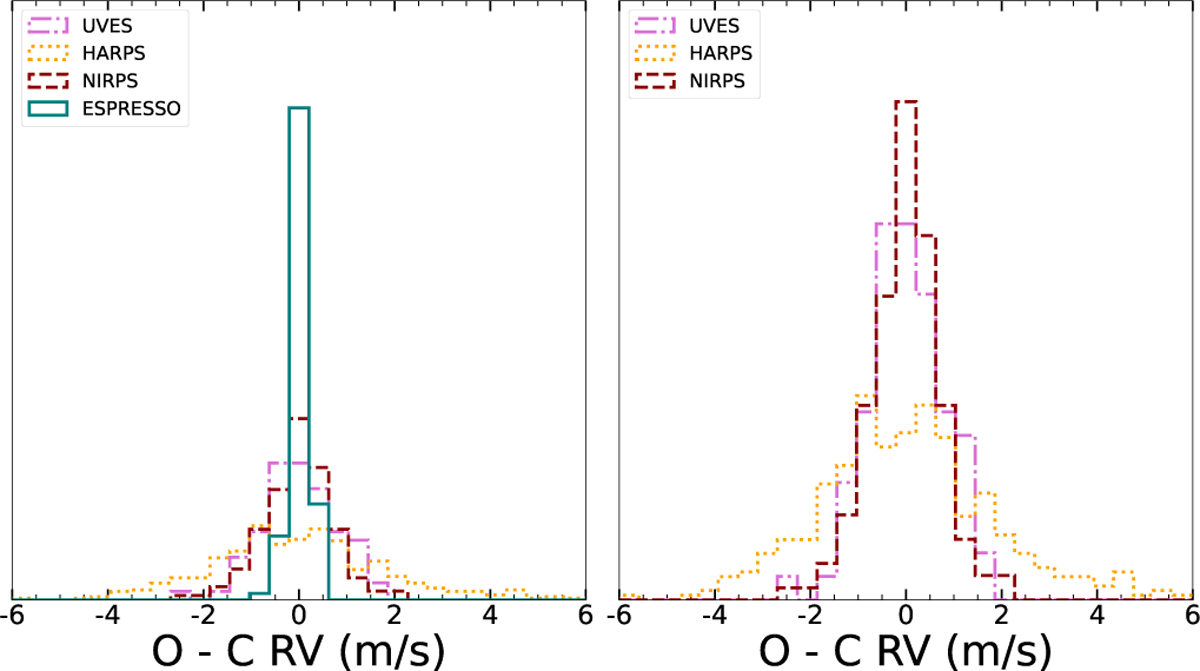
Comparison of RV residuals. Distribution of the residuals of the RV data after subtracting the best fit. The left panel includes all instruments. The right panel excludes ESPRESSO, for an easier visualisation of the rest.
Current usage metrics show cumulative count of Article Views (full-text article views including HTML views, PDF and ePub downloads, according to the available data) and Abstracts Views on Vision4Press platform.
Data correspond to usage on the plateform after 2015. The current usage metrics is available 48-96 hours after online publication and is updated daily on week days.
Initial download of the metrics may take a while.