Open Access
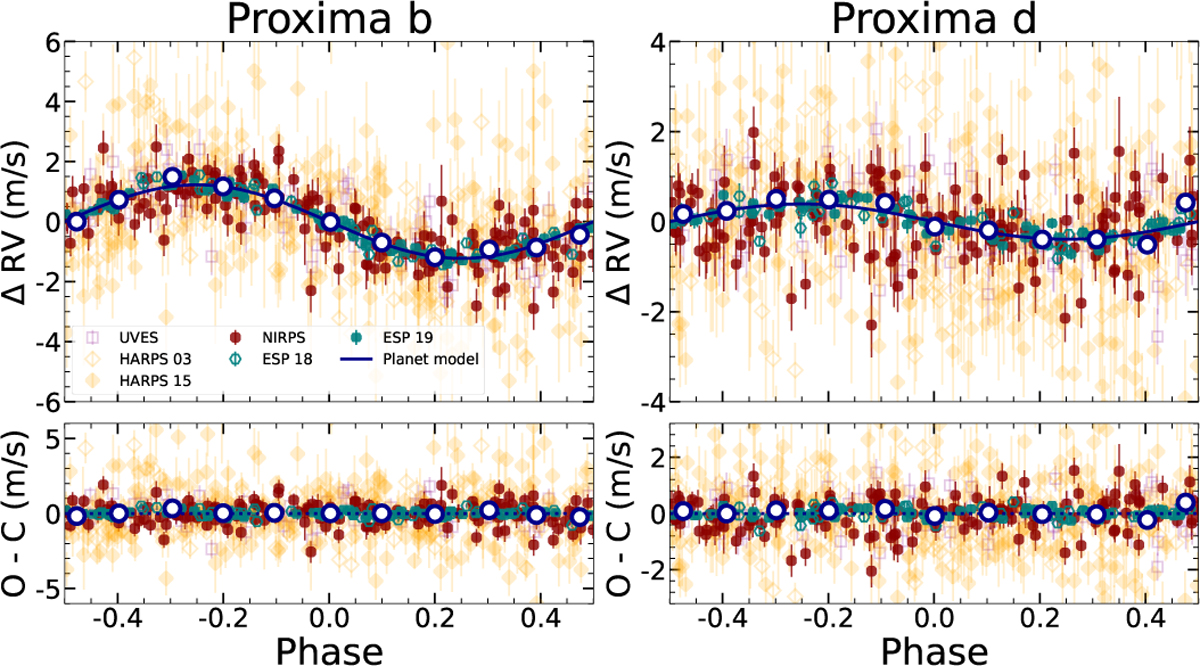
Fig. 15
Download original image
Phase-folded plots of the planetary-induced RV signals. RV variations induced by Proxima b and d with the best model fit (top panels), and the residuals after the fit (bottom panels). The blue circles with white filling show the average at every phase bin.
Current usage metrics show cumulative count of Article Views (full-text article views including HTML views, PDF and ePub downloads, according to the available data) and Abstracts Views on Vision4Press platform.
Data correspond to usage on the plateform after 2015. The current usage metrics is available 48-96 hours after online publication and is updated daily on week days.
Initial download of the metrics may take a while.