Fig. 1
Download original image
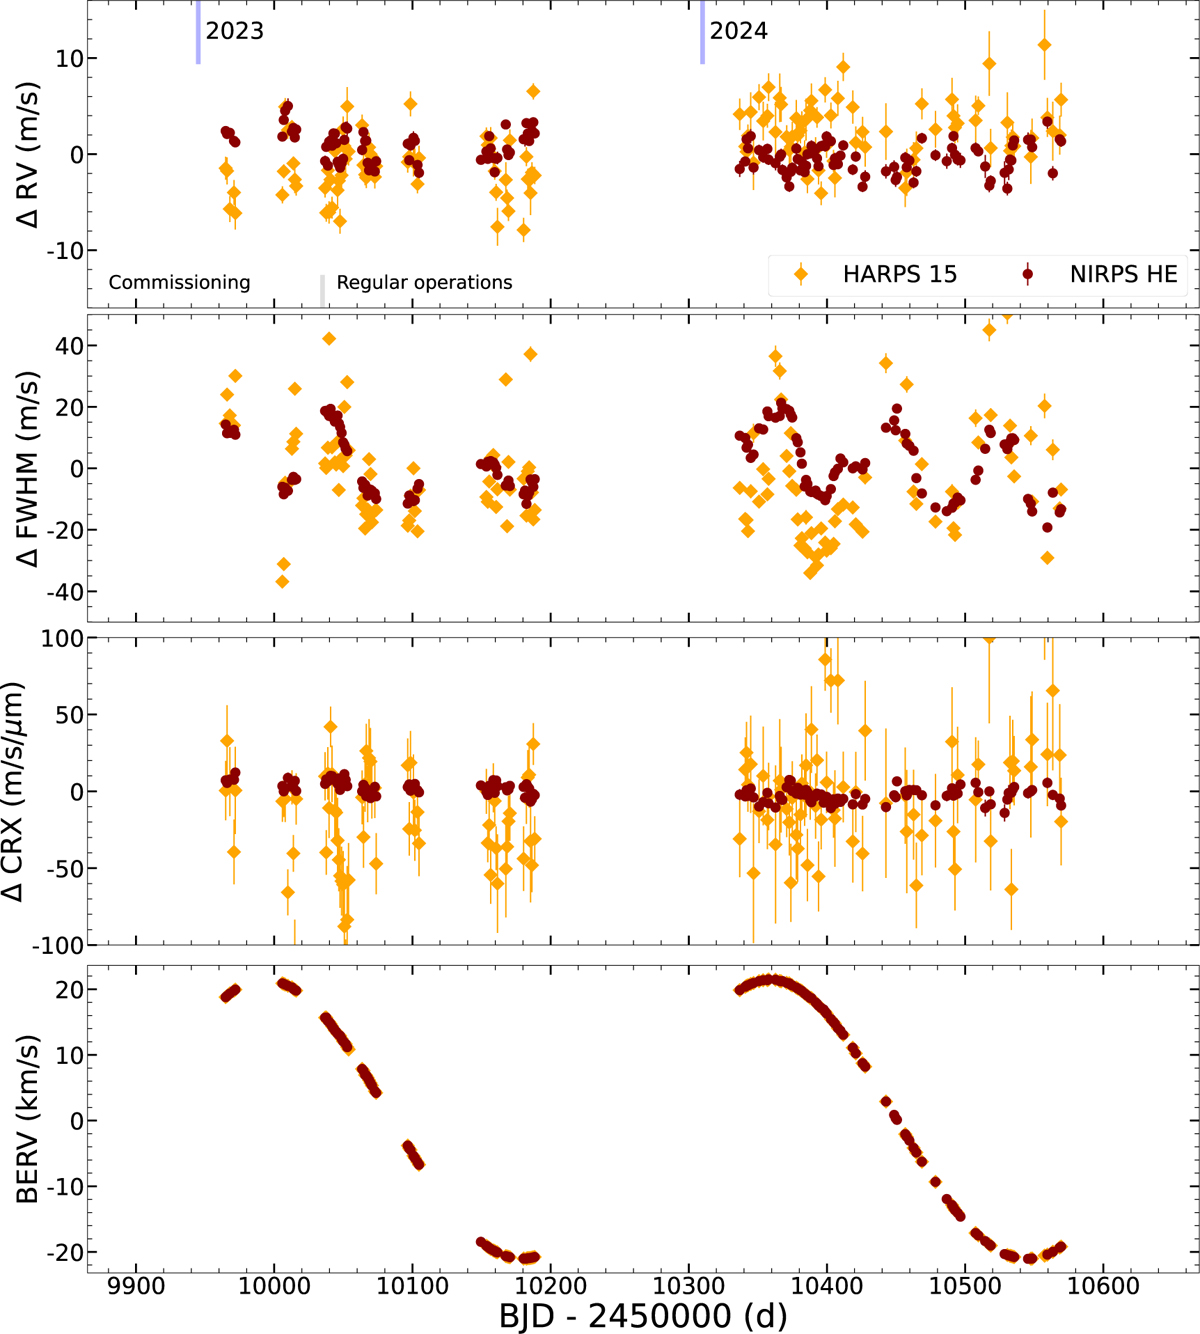
NIRPS GTO data. The upper panel shows the nightly binned RV data of NIRPS and HARPS, obtained by the NIRPS GTO. The uppermiddle panel shows the time series of FWHM of the same spectra. The lower-middle panel shows the CRX data. The lower panel shows the BERV at which the measurements were taken. All data has its median value subtracted.
Current usage metrics show cumulative count of Article Views (full-text article views including HTML views, PDF and ePub downloads, according to the available data) and Abstracts Views on Vision4Press platform.
Data correspond to usage on the plateform after 2015. The current usage metrics is available 48-96 hours after online publication and is updated daily on week days.
Initial download of the metrics may take a while.