Open Access
Fig. 6
Download original image
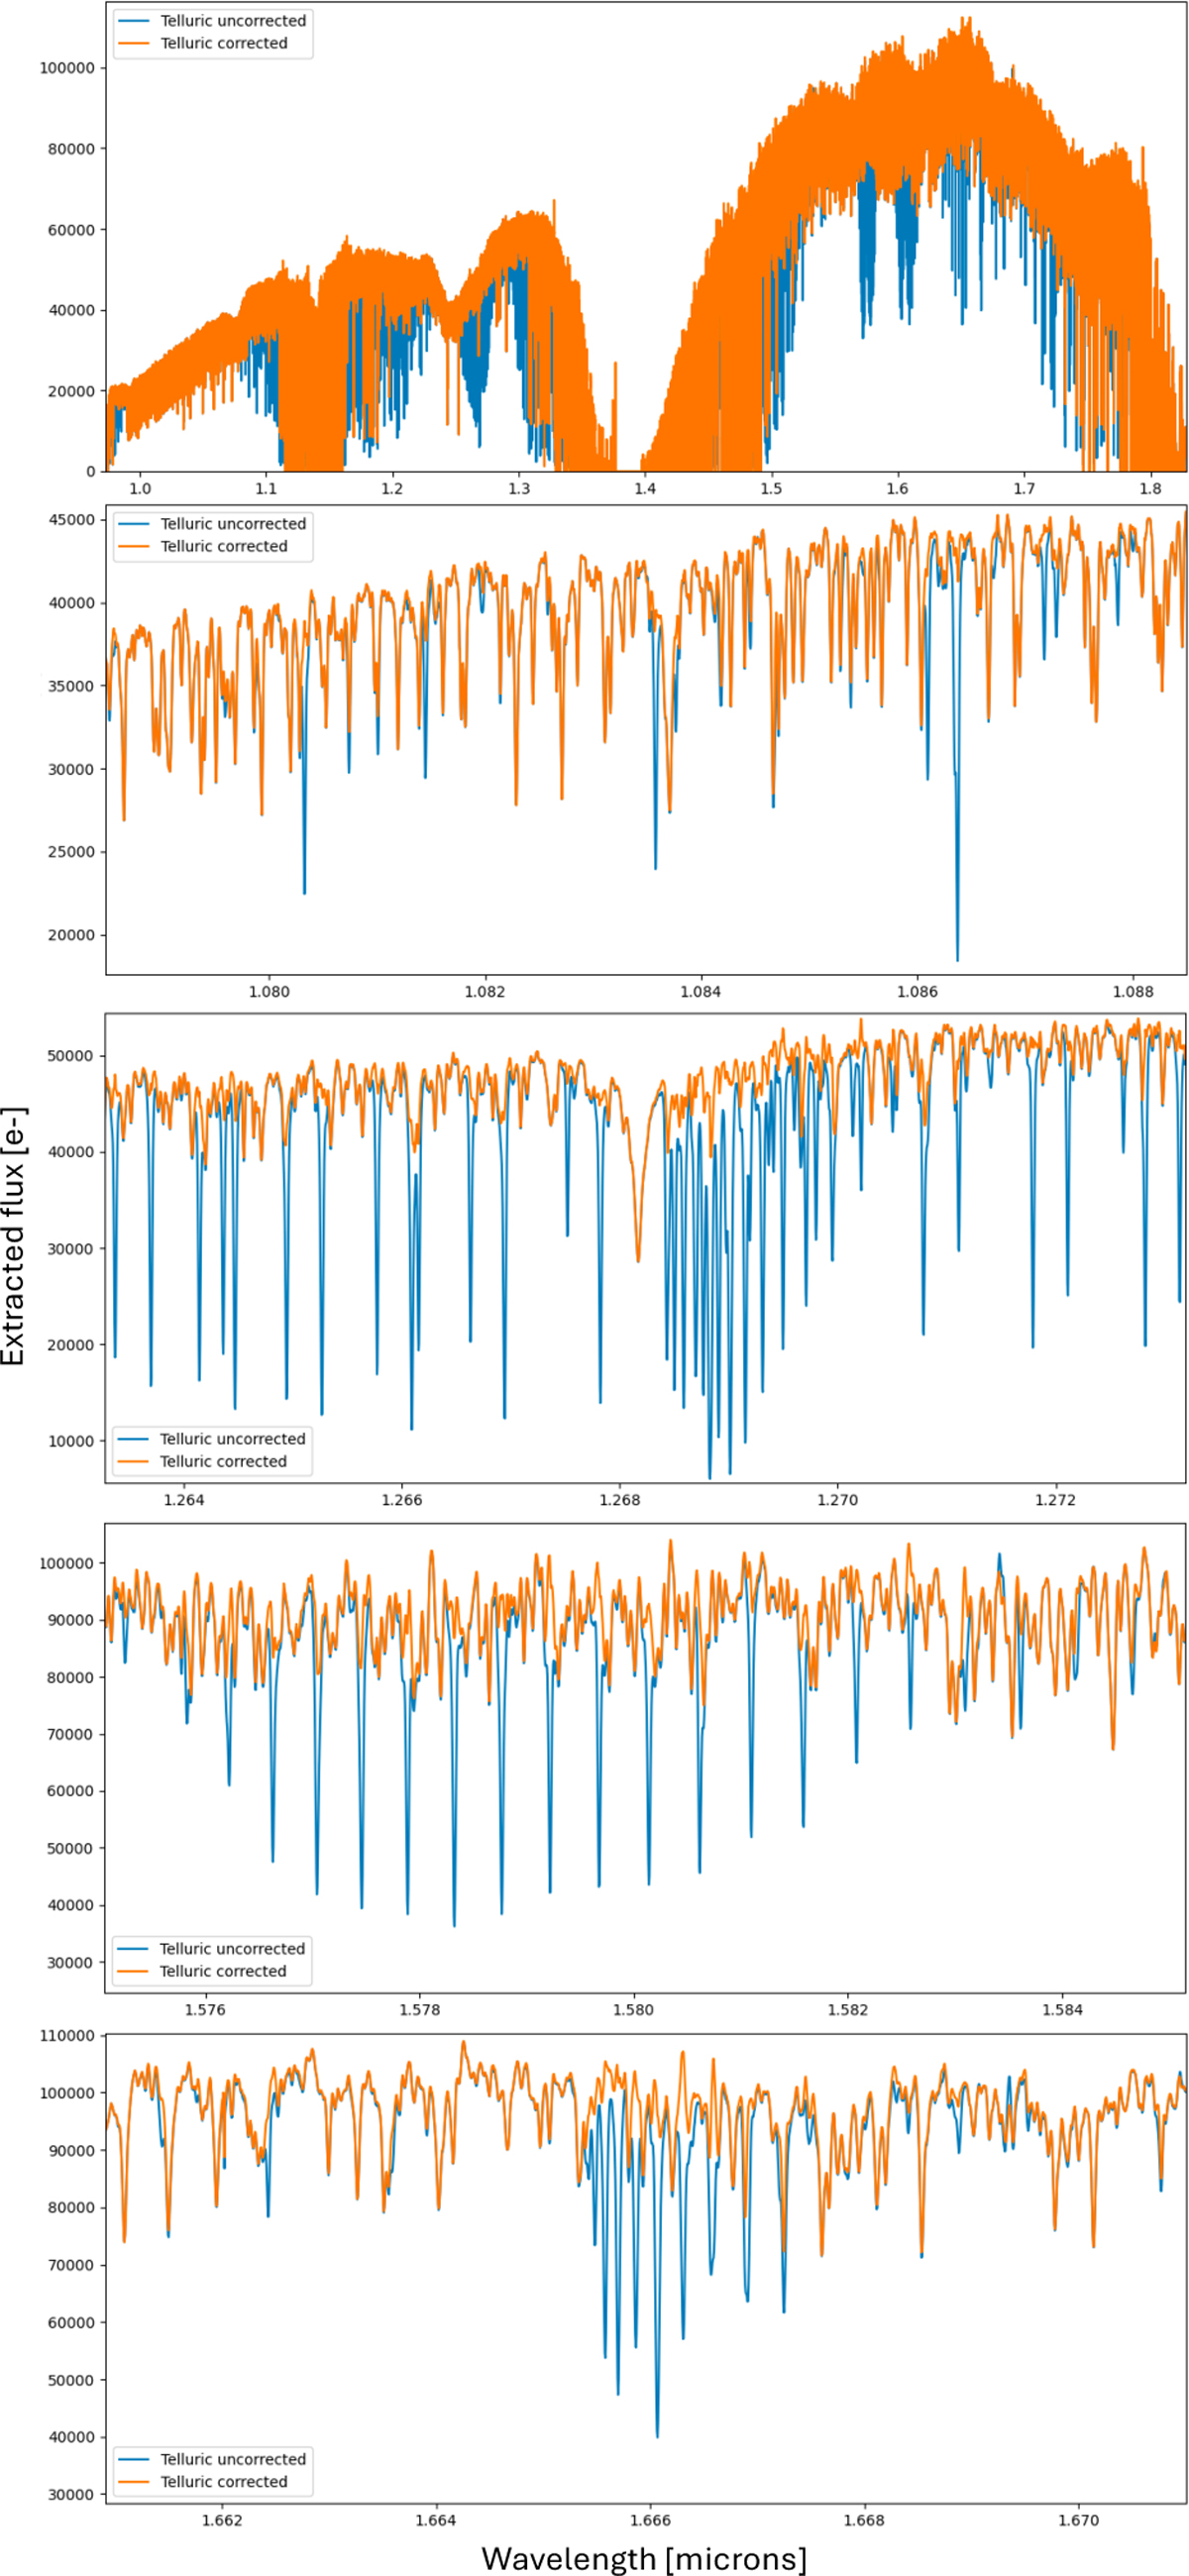
Top panel: full extracted and wavelength calibrated spectrum with NIRPS-DRS of Proxima observed in HE mode. Four bottom panels: zoom in on four different spectral domains. Blue curves and orange curves correspond to telluric uncorrected and telluric corrected spectra, respectively.
Current usage metrics show cumulative count of Article Views (full-text article views including HTML views, PDF and ePub downloads, according to the available data) and Abstracts Views on Vision4Press platform.
Data correspond to usage on the plateform after 2015. The current usage metrics is available 48-96 hours after online publication and is updated daily on week days.
Initial download of the metrics may take a while.