Fig. 14
Download original image
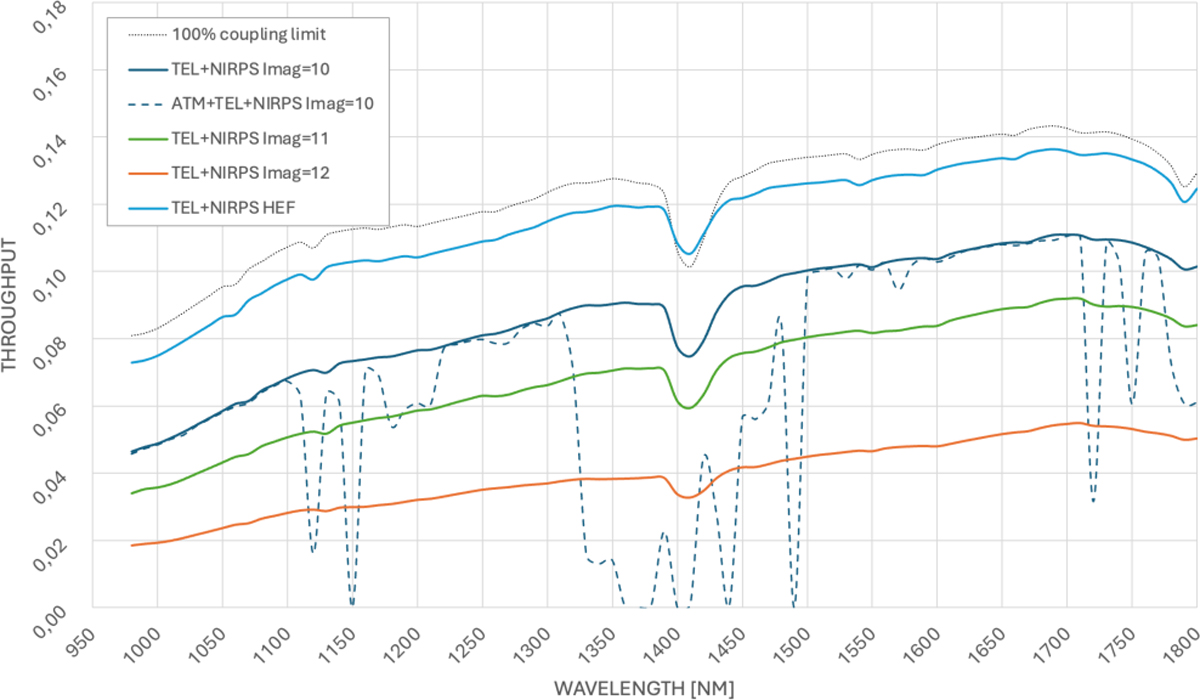
Expected overall throughput of NIRPS instruments for HA mode and different I magnitude for a 0.9″ seeing. The dark blue, green, and orange curves correspond to the overall throughput for I of 10, 11 and 12, respectively. The dashed curve represents the atmospheric absorption bands on top of the overall throughput computed for I = 10. The dotted curve shows the 100% coupling into the HA fibre. The blue curve corresponds to the overall predicted throughput for the HE mode for targets brighter than I=9.
Current usage metrics show cumulative count of Article Views (full-text article views including HTML views, PDF and ePub downloads, according to the available data) and Abstracts Views on Vision4Press platform.
Data correspond to usage on the plateform after 2015. The current usage metrics is available 48-96 hours after online publication and is updated daily on week days.
Initial download of the metrics may take a while.