Fig. 9.
Download original image
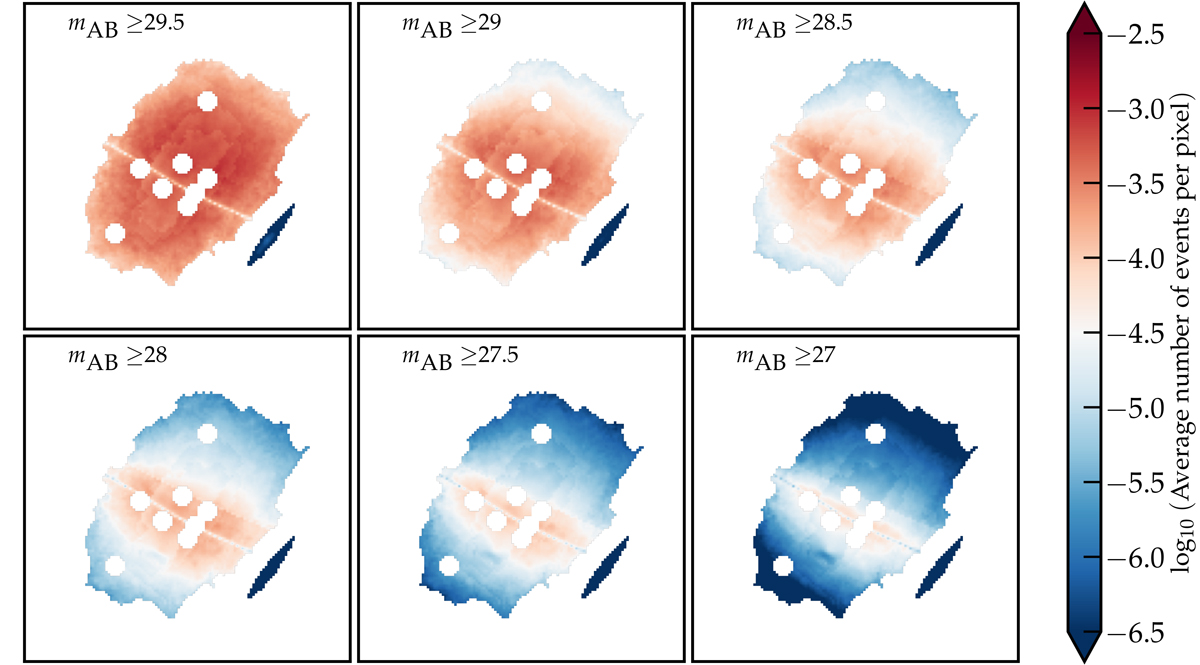
Spatial distribution of event probability predicted for different thresholds in F090W. Each pixel value represents the expected average number of detections above a certain threshold per pixel. The total number of pixels included in the galaxy mask and after masking out the globular clusters and possible events is roughly 5000. One pixel length corresponds to 32 mas, or 490 pc on the source plane if μ = 1. In shallow observations we only expect to see events at the critical curve. In deep observations, we expect to see events more uniformly distributed across the arc. Lower thresholds predict fewer events, which are asymmetrically distributed, favouring a negative parity. This is due to the increased Σ* closer to the BCG and the statistical properties of the negative parity regime. As the detection threshold increases, this asymmetry diminishes.
Current usage metrics show cumulative count of Article Views (full-text article views including HTML views, PDF and ePub downloads, according to the available data) and Abstracts Views on Vision4Press platform.
Data correspond to usage on the plateform after 2015. The current usage metrics is available 48-96 hours after online publication and is updated daily on week days.
Initial download of the metrics may take a while.