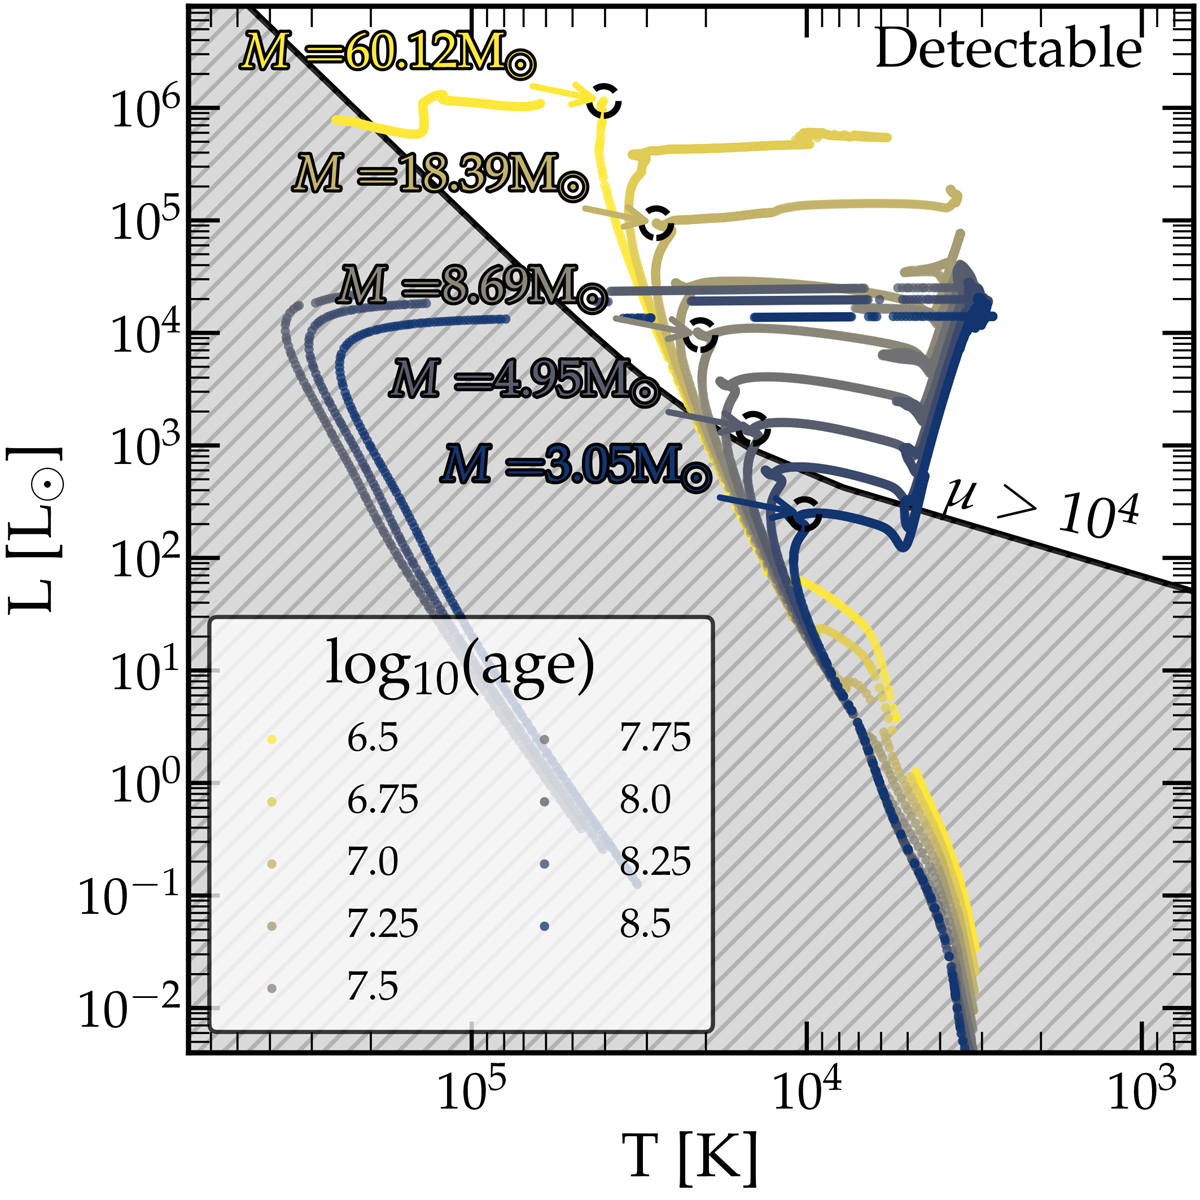
Fig. 4.
Download original image
Set of isochrones outputted by FSPS from the MIST stellar library at different stellar ages in region 1 and best-fit metallicity Z = 0.31 Z⊙. Each colour represents the same population as it evolves with time, with older populations growing dimer and redder. The solid black line delimits the regions of the diagram in which a magnification larger than a factor of 104 would be necessary to observe the star in at least one of the eight NIRCam filters used in this work at a limiting magnitude of 30. The shaded region is thus the stars that cannot be observed in any filter with these conditions. The arrows mark the turn-off points, where stars leave the main sequence. The corresponding masses indicate the stellar mass at which this transition occurs for a subset of the isochrones shown in the plot.
Current usage metrics show cumulative count of Article Views (full-text article views including HTML views, PDF and ePub downloads, according to the available data) and Abstracts Views on Vision4Press platform.
Data correspond to usage on the plateform after 2015. The current usage metrics is available 48-96 hours after online publication and is updated daily on week days.
Initial download of the metrics may take a while.