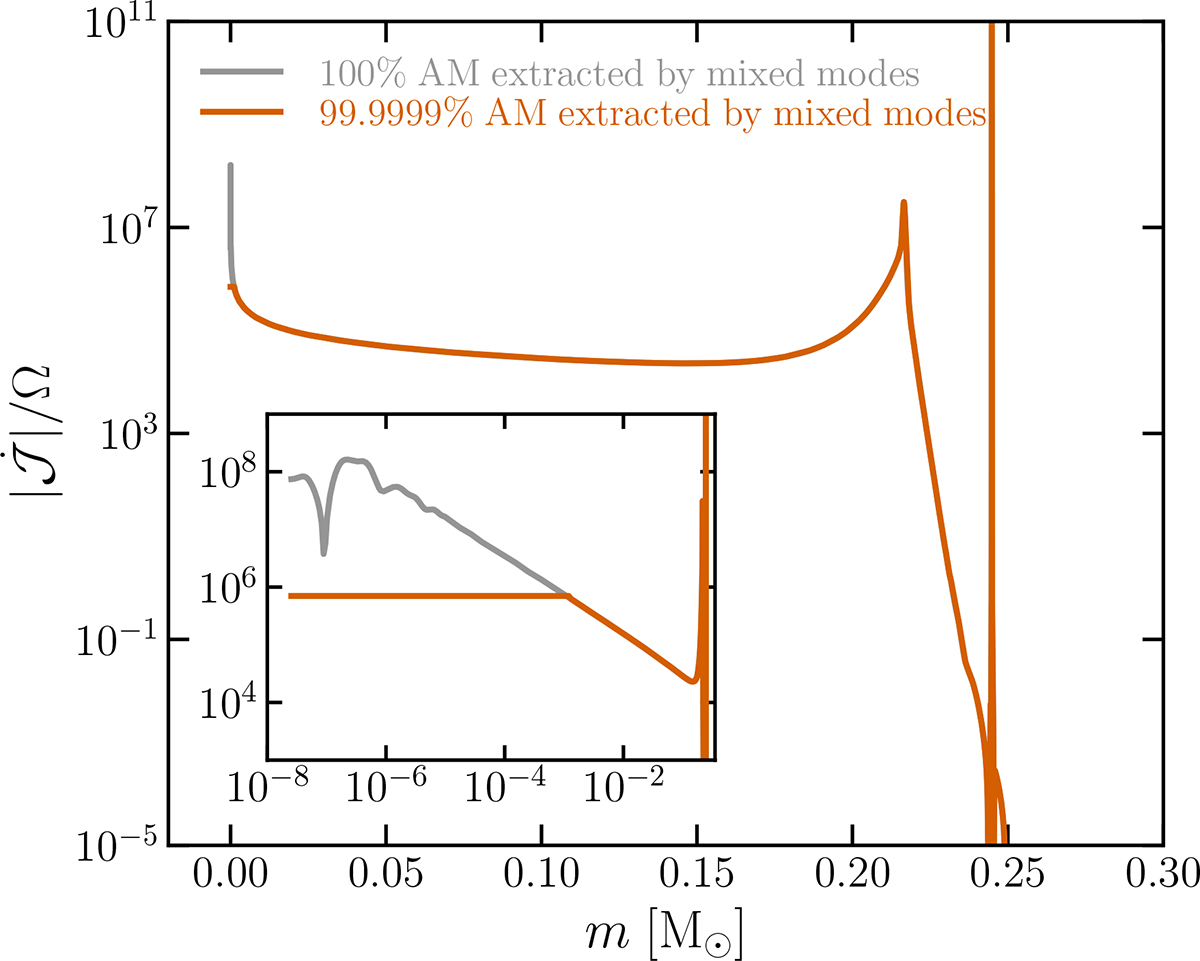
Fig. C.2.
Download original image
Absolute value for the mixed modes momentum flux normalised by the rotation rate (logarithmic scale) as a function of fractional radius for a 1.3 M⊙ model high in the RGB. The original mixed modes flux computed using Eq. 14 is represented by the grey line. The modified mixed modes flux is represented by the orange line. The smaller panel shows a close up of the very central region of the star where the flux was modified.
Current usage metrics show cumulative count of Article Views (full-text article views including HTML views, PDF and ePub downloads, according to the available data) and Abstracts Views on Vision4Press platform.
Data correspond to usage on the plateform after 2015. The current usage metrics is available 48-96 hours after online publication and is updated daily on week days.
Initial download of the metrics may take a while.