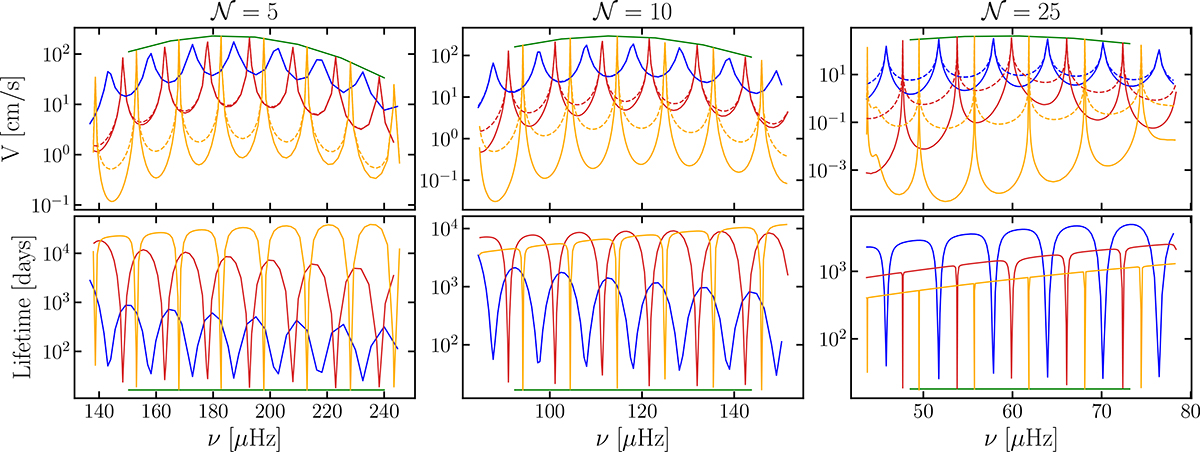
Fig. A.1.
Download original image
Top panel: Mode surface velocity (logarithmic scale) as a function of frequency for the models along a 1.0 M⊙ track. The line styles represent models with mode damping (solid lines) and without mode damping (dashed lines). The line colours represent the angular degrees l = 0,1,2,3 (green, blue, red, yellow). The left, central and right panels showcase models in different evolutionary stages (with different mixed modes density). Bottom panel: Mode lifetime (logarithmic scale) as a function of frequency.
Current usage metrics show cumulative count of Article Views (full-text article views including HTML views, PDF and ePub downloads, according to the available data) and Abstracts Views on Vision4Press platform.
Data correspond to usage on the plateform after 2015. The current usage metrics is available 48-96 hours after online publication and is updated daily on week days.
Initial download of the metrics may take a while.