| Issue |
A&A
Volume 699, July 2025
|
|
|---|---|---|
| Article Number | A21 | |
| Number of page(s) | 9 | |
| Section | Stellar structure and evolution | |
| DOI | https://doi.org/10.1051/0004-6361/202555365 | |
| Published online | 25 June 2025 | |
Is the Fermi source 4FGL J1824.2+1231 a transitional millisecond pulsar?
1
Ioffe Institute, 26 Politekhnicheskaya, St. Petersburg 194021, Russia
2
Instituto de Astronomía, Universidad Nacional Autónoma de México, Apdo. Postal 106, Baja California, México 22860, Mexico
3
Department of Astronomy and Satellite Geodesy, Kazan Federal University, Kremlevskaya Str. 18, Kazan 420008, Russia
4
Academy of Sciences of Tatarstan, Baumana Str. 20, 420111 Kazan, Russia
5
Space Research Institute of the Russian Academy of Sciences, Profsoyuznaya Str. 84/32, 117997 Moscow, Russia
6
Max-Planck-Institut für Astrophysik, Karl-Schwarzschild-Str. 1, D-85741 Garching, Germany
7
Ulugh Beg Astronomical Institute, Uzbekistan Academy of Sciences, Tashkent 100052, Uzbekistan
8
Peter the Great St. Petersburg Polytechnic University, Polytechnicheskaya st., 29, St. Petersburg 195251, Russia
9
SECIHTI, Instituto de Astronomía, Universidad Nacional Autónoma de México, 22860 Ensenada, BC, Mexico
⋆ Corresponding author: da.zyuzin@gmail.com
Received:
2
May
2025
Accepted:
26
May
2025
Context. Transitional millisecond pulsars (tMSPs) in tight binary systems represent an important evolutionary link between low-mass X-ray binaries and radio millisecond pulsars. To date, only three confirmed tMSPs and a few candidates have been discovered. Most of them are γ-ray sources. For this reason, searching for multi-wavelength counterparts to unassociated Fermiγ-ray sources can help us find new tMSPs.
Aims. We investigate whether the unassociated γ-ray source 4FGL J1824.2+1231 belongs to the tMSP family.
Methods. To find the counterpart to 4FGL J1824.2+1231, we used data from the SRG/eROSITA and Swift X-ray catalogues and from different optical catalogues. We also performed time-series photometric optical observations of the source with the 2.1 m telescope of the Observatorio Astronómico Nacional San Pedro Mártir, the 1.5 m telescope of the Maidanak Astronomical Observatory, and the 1.5 m Russian-Turkish telescope. In addition, we carried out optical spectroscopic observations with the Russian-Turkish telescope and used archival spectroscopic data obtained with the Gemini-North telescope.
Results. Within the position error ellipse of 4FGL J1824.2+1231, we find only one X-ray source that coincides with an optical object. We consider it a likely multi-wavelength counterpart to 4FGL J1824.2+1231. The source shows strong optical variability and significant proper motion. The latter strongly implies that it is a Galactic source. Double-peaked H and He emission lines are detected in its spectrum with a flat continuum, as often observed in accretion disks of compact binary systems. The X-ray spectrum is well fitted by a power law with a photon index of ∼1.7. The derived intrinsic X-ray-to-γ-ray flux ratio is about 0.2.
Conclusions. Assuming the X-ray/optical source is the true counterpart to 4FGL J1824.2+1231, all its properties suggest that it is a tMSP in the sub-luminous disk state.
Key words: binaries: close / binaries: general / stars: neutron / stars: individual: 4FGL J1824.2+1231
© The Authors 2025
 Open Access article, published by EDP Sciences, under the terms of the Creative Commons Attribution License (https://creativecommons.org/licenses/by/4.0), which permits unrestricted use, distribution, and reproduction in any medium, provided the original work is properly cited.
This article is published in open access under the Subscribe to Open model. Subscribe to A&A to support open access publication.
1. Introduction
The Fermi Gamma-ray Space Telescope has identified a large number of binary millisecond pulsars (MSPs), including members of the ‘spider’ class, redbacks (RBs) and black widows (BWs; e.g. Roberts 2013; Strader et al. 2021; Swihart et al. 2022). These are compact binaries with orbital periods Pb ≲ 1 d for which one side of the companion star is heated by the pulsar wind. RBs have companions with masses of 0.1–1 M⊙, while masses of BW companions are ≲0.05 M⊙. It is commonly accepted that MSPs are formed in binary systems, where they are spun up to short rotational periods (P < 30 ms) due to the accretion of matter and angular momentum from their main-sequence companions during the low- or intermediate-mass X-ray binary stages (Bisnovatyi-Kogan & Komberg 1974; Alpar et al. 1982). Of particular interest is the discovery of RBs that show transitions between the rotation-powered and active X-ray regimes, confirming the tight evolutionary link between low-mass X-ray binaries (LMXBs) and radio MSPs (see Papitto & de Martino 2022 and references therein).
As the companion in spider binaries is ablated by the energetic pulsar wind, the ablated material creates a cloud around the pulsar, obscuring the pulsar radio emission and causing eclipses. For this reason, detection of radio pulsations from spiders can be challenging. However, such objects can be identified through X-ray and optical observations of unassociated Fermi sources, even when pulsations are not detected, through periodic modulations of the optical and/or X-ray flux caused by the orbital motion in a binary system (e.g. Salvetti et al. 2017).
To date, only three confirmed transitional MSPs (tMSPs) have been detected, namely PSRs J1023+0038 (Archibald et al. 2009), J1227−4853 (Bassa et al. 2014; Roy et al. 2015), and J1824−2452I (Papitto et al. 2013). In addition, several sources have been proposed as candidate tMSPs in the so-called sub-luminous disk state (e.g. Bogdanov 2016; Strader et al. 2016; Coti Zelati et al. 2019; Miller et al. 2020) based on their spectral properties: H and He emission lines in the optical due to the presence of the accretion disk, a power-law-shaped spectrum in X-rays with a photon index of ≈1.7, and variability such as flaring activity and high and low brightness modes in the ultraviolet (UV), optical, and X-rays. The γ-ray emission in the sub-luminous state is a few times brighter than in the rotation-powered regime (Papitto & de Martino 2022, and references therein). In the radio, continuum emission with a flat or a slightly inverted spectrum is observed. For PSR J1023+0038, simultaneous radio and X-ray observations revealed an anti-correlated variability pattern: the radio flux increases when the source switches from the high to the low X-ray mode (Bogdanov et al. 2018).
Transitional MSPs are of great interest in studies of binary evolution, accretion processes, the interaction of the pulsar magnetic field and pulsar wind with inflowing plasma, and fundamental physical properties of the super-dense matter of neutron stars. Thus, new identifications and studies of companions in tMSPs are necessary. In this regard, investigations of about 2600 unassociated Fermi sources are promising: as suggested in recent studies, ∼8% of these sources are good binary or isolated pulsar candidates (Kerby et al. 2021; Mayer & Becker 2024).
Here we report on the discovery of the likely X-ray/optical counterpart to the unassociated γ-ray source 4FGL J1824.2+1231 (hereafter J1824). According to the Fermi Large Area Telescope 14-Year Point Source Catalog (Ballet et al. 2023), its flux in the 0.1–100 GeV band is Fγ = 2.7(9)×10−12 erg s−1 cm−2, its γ-ray spectrum can be described by the LogParabola model, and no significant variability was detected, implying that it could be a pulsar. We find that the J1824 counterpart candidate demonstrates properties typical of a tMSP in the sub-luminous accretion disk state. The X-ray/optical identification is described in Sect. 2, and observations in Sect. 3. The analysis and results are presented in Sect. 4, and a discussion and conclusions are given in Sect. 5.
2. X-ray/optical counterpart identification
We examined X-ray data of the J1824 field obtained with the extended ROentgen Survey with an Imaging Telescope Array (eROSITA) telescope (Predehl et al. 2021) aboard the Spectrum-RG (SRG) orbital observatory (Sunyaev et al. 2021). In addition, we revised the Living Swift-XRT Point Source (LSXPS) catalogue (Evans et al. 2023). In both surveys, we find only one X-ray source inside the Fermi 68% confidence error ellipse: J1824 (see the left panel of Fig. 1). The eROSITA designation for this source is SRGe J182408.9+123234, while for LSXPS it is J182408.7+123231. Its coordinates are RA = 18h24m08 91 and Dec. = +12°32′34
 1 with the 98% position uncertainty of 3
 6. We propose the source as an X-ray counterpart candidate to the γ-ray object.
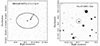 |
Fig. 1. Images of the J1824 field. Left: 20′ × 20′ eROSITA image in the 0.3–2.3 keV range. The J1824 γ-ray position is marked by the cross, and the ellipse shows the 68% position uncertainty. The likely X-ray counterpart of J1824 is marked by the arrow. Right: 1′ × 1′ Pan-STARRS image in the r band. The circle shows the 98% position uncertainty of the X-ray source obtained with eROSITA. The likely optical counterpart is seen inside the circle. |
Investigating optical data from the Panoramic Survey Telescope and Rapid Response System survey Data Release 2 (Pan-STARRS DR 2; Flewelling et al. 2020), we found a source, PSO J276.0370+12.5426, that spatially coincides with the J1824 X-ray counterpart candidate (see Fig. 1, right) and thus can be considered as its optical counterpart. Its coordinates are RA = 18h24m08 88660(15) and Dec. = +12°32′33
 400(2). The source is also presented in the Gaia DR 3 (Gaia Collaboration 2016, 2023) and Zwicky Transient Facility DR 23 (ZTF; Masci et al. 2019) catalogues. According to Gaia, the distance to the source is in the range 1.3–3.8 kpc (Bailer-Jones et al. 2021) and its proper motion is μ = 18.5(3) mas yr−1, implying the Galactic origin.
The ZTF and Pan-STARRS data demonstrate a strong variability of the optical candidate at timescales from a month to a couple of years, with the brightness in the r band changing from 18.4 to 19.9 mag (see Fig. 2). However, the small number of optical observations prevents us from performing timing analysis to search for possible periodic variations. In addition, the source was detected in the UV with the Galaxy Evolution Explorer (GALEX; Martin et al. 2005). Its observed flux density in the near-UV (∼2310 Å) band is (4.2 ± 1.5)×10−17 erg s−1 cm−2 Å−1. The object was also detected in the infrared with the Wide-field Infrared Survey Explorer in two bands: W1 (3.4 μm) = 276.5±7.6 and W2 (4.6 μm) = 428.9 ± 26.6 (all fluxes are in Vega nanomaggies; Finkbeiner et al. 2004). This corresponds to flux densities of W1 = 2.30(6)×10−18 erg s−1 cm−2 Å−1 and W2 = 1.02(6)×10−18 erg s−1 cm−2 Å−1.
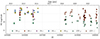 |
Fig. 2. Optical light curves of the J1824 counterpart candidate based on data from the Pan-STARRS (PS) and ZTF catalogues in different filters (see the legend). |
To shed light on the nature of the optical/X-ray source, we re-analysed the X-ray data and performed new multi-epoch optical spectroscopic and time-series photometric observations.
3. Observations
3.1. Optical photometry and spectroscopy
Time-series photometric optical observations of J1824 were performed with the 2.1 m telescope at the Observatorio Astronómico Nacional San Pedro Mártir (OAN-SPM) in Mexico, the 1.5 m telescope at the Maidanak Astronomical Observatory (MAO) in Uzbekistan, and the Russian-Turkish 1.5 m optical telescope (RTT-150) at the Turkish National Observatory in Antalya, Turkey1. RTT-150 was also used for optical spectroscopy. The log of observations is given in Tables 1 and 2.
Photometric observations of the likely counterpart to J1824 with the OAN-SPM 2.1 m, Maidanak 1.5 m, and RTT 150 telescopes.
Optical spectroscopic observations of the likely counterpart to J1824 with the RTT-150 telescope.
3.1.1. OAN-SPM photometry
The OAN-SPM observations were carried out using the B, V and R Johnson-Cousins filters with the Rueda Italiana instrument2 in May, June, and September 2023. The field of view (FoV) of the detector is 6′ × 6′ with an image scale of 0 34 in the 2×2 CCD pixel binning mode. The photometric calibration was performed using the Landolt standards SA 109-949, 954, 956 (Landolt 1992).
3.1.2. MAO photometry
The MAO observations of J1824 were carried out on September 13, 2023. We used the AZT-22 1.5 m telescope (f/7.74) with the ANDOR- iKon-XL 4k CCD and Bessell V filter. The detector pixel scale is 0 266 pix−1, and the FoV is about 18
 1 × 18
 1. A total of 27 frames were taken during about 3.5 hours with an exposure time of 300 s.
3.1.3. RTT-150 photometry
The RTT-150 optical photometry was performed using the r filter on September 13, 2022. To increase the time resolution to 3 min, observations without filters were performed on July 26, 2024, with the passband close to the GaiaG band. The telescope is equipped with the TUBITAK Faint Object Spectrograph and Camera instrument with the Andor iKon-L 936 BEX2-DD-9ZQ 2048 × 2048-pixel CCD array. The TFOSC FoV is 11′×11′ with a pixel scale of 0 33 for the 1×1 binning.
3.1.4. RTT-150 optical spectroscopy
We obtained low-resolution optical spectra of the source with the RTT-150 + TFOSC between 2022 and 2024 (see Table 2). Couple spectra with an exposure time of 3600 s were obtained using grism 15 and a 134 μ entrance slit (corresponding to 2 4 at the sky). The wavelength range was 3900–8900 Å and the spectral resolution was 15 Å.
3.1.5. Archival optical spectroscopy with Gemini-N
Spectral observations of the optical counterpart were carried out with the Gemini-North telescope on August 19, 2022 (PI S. Swihart). Two consecutive long-slit spectra with 15-minute exposures were obtained using the Gemini Multi-Object Spectrograph with the R400_G5305 grating in conjunction with the GG455_G0305 long-pass filter and the slit width of 1″, resulting in the spectral coverage 4500–10 300 Å and resolution of 8 Å at a blaze wavelength of 7640 Å.
3.2. X-ray data
J1824 field was observed in X-rays with Swift X-Ray Telescope (XRT) eight times in 2019–2020 with the total exposure time of 3.6 ks (ObsIDs 03110651001, 03110651002, 03110651005, and 03110651007–03110651009). In 2019–2021, the J1824 field was observed with eROSITA with a total exposure was 840 s (vignetting corrected exposure – 509 s).
4. Analysis and results
4.1. Optical light curves at short timescales
Using the Image Reduction Analysis Facility (IRAF) package (Tody 1986, 1993), we carried out standard processing of the photometric data, including bias subtraction and flat-fielding. We employed the aperture photometry to extract the target light curves. Using a differential technique with the non-variable bright field star Gaia DR 3 44850646487679229443 as a reference, we eliminated the variations caused by unstable weather conditions during the observations.
We obtained 17 uninterrupted light curves of the J1824 counterpart candidate that cover time spans of up to 4 hours per night with the time resolution ∼200–300 s in different bands between 2022 and 2024. The curves obtained during a specific night generally demonstrate irregular brightness variations. Examples of the V-band curves obtained in 2023 are presented in Fig. 3. As seen, on some nights (e.g. May 31 and September 14 and 16), the source was observed in a relatively stable state with V ≈ 20 mag accompanied by 10–20 min flickering with an amplitude of ΔV ≈ 0.3–0.4 mag. However, on some other nights (June 1 and September 15) it demonstrated relatively strong flares, with ΔV ≈ 1 mag and ≈1 h duration. Similar behaviour was observed at other epochs in different bands (Fig. 4). For instance, on May 23, 2023, the source showed an ≈0.5 h long flare in the B and R bands, and a flickering before and after it, while on July 26, 2024, the source was relatively stable with a flickering of ≲0.3 mag, as seen from the light curve in the G band.
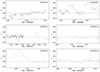 |
Fig. 3. Heliocentric light curves of the likely optical companion to J1824 obtained with the OAN-SPM (dots) and Maidanak (triangles) telescopes in the V band on different dates, as indicated in the panels. The dashed line shows the level of the possible stable state of the source (V = 20.0 mag), which is the median magnitude defined excluding flaring episodes. |
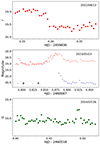 |
Fig. 4. Heliocentric light curves of the likely optical companion to J1824 obtained with the RTT-150 (squares; top and bottom panels) and OAN-SPM (dots; middle panel) telescopes on different dates, as indicated in the panels. G-, B-, and R-band magnitudes are given in the Vega system, and the r-band magnitudes in the AB system. |
The amplitudes of the brightness variations in our data are generally consistent with the range of the variability found in the sparse ZTF and Pan-STARRS data (Fig. 2). At the same time, using the Lomb-Scargle periodogram method (Lomb 1976; Scargle 1982), we found no significant periodic brightness modulation in our less sparse and noisy data within the period search range from 30 min to 24 h.
4.2. Optical spectra
The processing of the RTT-150 spectral data was performed using the DECH software (Galazutdinov 2022). To obtain the source flux densities, the spectra of the spectrophotometric standard stars BD17d4708 and BD26d2606 were obtained during the same nights as the target.
The Gemini data processing was performed using the DRAGONS package (Labrie et al. 2023). To calibrate the flux, spectra of the spectrophotometric standard EG131 were obtained during the same night as the target.
Optical spectra of J1824 demonstrate a flat non-stellar continuum with hydrogen Balmer and Paschen and He I emission lines. Typical examples of spectra obtained with RTT-150 are presented in Fig. 5. They are corrected for the interstellar reddening E(B − V)≈0.14 mag, which is the maximal value in the source direction according to the 3D dust map by Green et al. (2019). The reddening quickly increases with the distance and reaches its maximum at about 1.45 kpc, which is close to the lower limit on the distance of the source. As seen from these figures, within the spectral resolution of RTT-150, the H I and He I lines are single peaked, their intensities vary in time by a factor of two, and no significant He II emission and/or any absorption features are resolved. The profiles of Balmer lines in the spectrum obtained on August 10, 2024, when they were the brightest, are blue-shifted by about 8 Å with respect to the rest of the spectra.
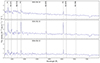 |
Fig. 5. Unabsorbed optical spectra of the likely optical counterpart to J1824 obtained with RTT-150 on different dates. The positions of H and He lines are shown. |
The combined spectrum obtained with Gemini is shown in Fig. 6. It has a higher quality and spectral resolution, as compared to that from the RTT-150, and allows one to see the spectrum of the source at longer wavelengths, where the double-peaked structure of He I 6678, 7065 Å and hydrogen Paschen lines is resolved. At the same time, Hα and possibly He I 5876 emission lines remain single-peaked as in the RTT-150 spectra, probably due to low spectral resolution in the bluer part of the spectrum. As an example, the distances between two peaks of the He I 7065 Å and Pa 11 emission lines are about 14.8 Å and 18.5 Å, respectively (both correspond to ≈630 km s−1). They were calculated from the difference of the centroids of the two-component Gaussian profile used to fit the observed lines. The full width at half maximum of the Hα line is about 960 km s−1. We note that He II 4686 line is not detected in the Gemini spectrum, likely due to the low efficiency below ≈4800 Å and/or its weakness.
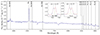 |
Fig. 6. Unabsorbed optical spectrum of the likely optical counterpart to J1824 obtained with the Gemini-North. Positions of H and He lines are shown. Zoomed-in regions around He I 7065 and Pa 11 lines are presented in the insets. The separations between the two peaks are marked. The best-fitting two-component Gaussian models are shown by the dashed red lines, and their components by the dashed green and orange lines. |
4.3. X-ray spectra and variability
We extracted spectra and light curves of the source from the Swift/XRT and SRG/eROSITA data. For the Swift data, we used the Swift-XRT data products generator4 (Evans et al. 2009). The eROSITA source counts were extracted from a 60″-radius circle. For the background, we used an annulus region with inner and outer radii of 150″ and 300″ around the source.
No significant X-ray variability of the J1824 counterpart candidate was detected with Swift/XRT and eROSITA: mean count rates in different observations are compatible with each other at a ≲2σ level5 (see Fig. 7). The low number and short duration of the observations together with the faintness of the source prevented the analysis of the count rate bimodality, which is a characteristic feature of tMSPs.
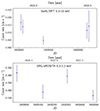 |
Fig. 7. X-ray light curves of the likely counterpart to J1824 obtained with Swift/XRT and SRG/eROSITA. |
Since the source variability is not significant, we analysed the time integrated spectra. As a result, we obtained 28 and 83 net counts in total for the Swift (0.3–10 keV band) and eROSITA (0.3–9 keV band) data, respectively. Both spectra were binned to ensure ≥1 counts per energy bin. We fitted the spectra with the X-Ray Spectral Fitting Package (XSPEC) v.12.13.1 (Arnaud 1996). Due to the low number of counts, we used C statistics (Cash 1979). To account for interstellar absorption, we applied the tbabs model and wilm abundances (Wilms et al. 2000) and the maximum reddening value mentioned above. Using the empirical relation from Foight et al. (2016), we converted E(B − V) to the absorption column density, obtaining NH = 1.2 × 1021 cm−2. We fixed this value during the fitting procedure6.
We find that the spectra can be well described by the power-law model, and their photon indices and model normalisations are in agreement within 1σ uncertainties. Thus, we fitted the spectra simultaneously with common parameters, resulting in the photon index Γ = 1.74 ± 0.19, the unabsorbed flux of  erg s−1 cm−2 in the 0.5–10 keV band and C = 83 for 111 degrees of freedom (the uncertainties correspond to 1σ confidence intervals). The spectra with the best-fitting model are shown in Fig. 8.
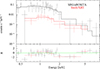 |
Fig. 8. X-ray spectrum of the J1824 likely counterpart obtained with eROSITA and Swift, the best-fitting power-law model (top panel) and residuals (bottom panel). For illustrative purposes, the spectra were grouped to ensure at least three counts per bin. |
5. Discussion and conclusions
We have found a likely X-ray/optical counterpart to the unassociated γ-ray source J1824. The counterpart is definitely located in the Galaxy since it has a significant proper motion of 18.5 mas yr−1 and the distance is estimated to be in the range 1.3–3.8 kpc.
The source magnitudes in the Gaia catalogue are G = 19.3, GBR = 19.97, and GRP = 18.54, which gives the colour GBR − GRP = 1.43 mag. Using its X-ray flux and G-band magnitude, we estimated the X-ray-to-optical flux ratio (FX/Fopt) to be ∼3. This value, together with the optical colour, corresponds to classes of accreting compact objects (see Fig. 1 in Rodriguez 2024), which include cataclysmic variables (CVs), super-soft sources, LMXBs, high-mass X-ray binaries, and binary MSPs (BWs and RBs, including tMSPs).
The presence of Balmer hydrogen and He emission lines in the optical spectrum of J1824’s likely counterpart supports the interpretation of the source as an accreting system. In the case of an accretion disk, lines usually show double-peaked profiles due to the Doppler motions of the matter within the binary. This is seen in the spectra obtained with Gemini. The blueshift of about 8 Å (≈300 km s−1) seen in one of the RTT-150 spectra can be caused by either the orbital motion or accretion outflow. Spectroscopy with high time resolution is necessary to clarify that.
We investigated the long-term variations in the source (Fig. 2) and found no evidence of the prolonged low-emission states that are usually observed in polars and intermediate polars (e.g. Mason & Santana 2015; Covington et al. 2022; Kolbin et al. 2024). We did not find periodic variations in the optical data. The source’s short-term behaviour is rather complex: the relatively stable states with V ≈ 20 mag are accompanied by flickering and flares of various amplitudes (∼0.4–1 mag) and durations (∼10 min–2 h). Such rapid optical variability is different from that of most CVs, but is typical for tMSPs (Papitto & de Martino 2022).
If the object is indeed a counterpart to the Fermi source J1824, then its X-ray (0.5–10 keV) and γ-ray (0.1–100 GeV) luminosities are  erg s−1 and Lγ = (3.2 ± 1.1)×1032Dkpc2 erg s−1, where Dkpc is the distance in units of kpc. For the distance range 1.3–3.8 kpc mentioned above, this yields LX ≈ 1032–1033 erg s−1 and Lγ ≈ (0.36 − 6.2)×1033 erg s−1. The X-ray-to-γ-ray flux ratio, FX/Fγ = 0.21 ± 0.08, and the derived photon index of the X-ray spectrum, Γ ≈ 1.7, are typical for tMSPs in the sub-luminous disk state (see Fig. 9 and Papitto & de Martino 2022). The X-ray luminosity range is also compatible with this class, which shows ∼1033–1034 erg s−1. This supports a tMSP nature for J1824.
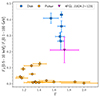 |
Fig. 9. X-ray to γ-ray flux ratio vs X-ray photon index for tMSPs and tMSP candidates in the sub-luminous disk state (blue squares) and RBs or tMSPs in the pulsar regime (orange circles; adopted from Miller et al. 2020). The position of J1824 is shown by the magenta triangle. |
We can rule out an LMXB nature for this source since its X-ray spectrum with a photon index of Γ ≈ 1.7 is harder than those of LMXBs in the luminosity state: LX ∼ 1032–1033 erg s−1 (Tanaka et al. 1997). It is also harder than super-soft source spectra (Ness 2020). The source is too faint to be a high-mass X-ray binary with large and bright OB-type donors with absolute magnitudes of MV < 0 (e.g. Wegner 2000).
On the other hand, based on the optical and X-ray properties, we cannot completely rule out the possibility that the source belongs to the CV family. If so, its association with the γ-ray source J1824 is unlikely since only a few CVs have been detected in γ-rays. These are nova eruptions (e.g. Sokolovsky et al. 2022, 2023) and possibly two rapidly rotating magnetic CVs, AE Aqr, and AR Sco (Meintjes et al. 2023). We also note that the two confirmed tMSPs, PSR J1023+0038 and PSR J1227−4853, were initially classified as CVs (Bond et al. 2002; Masetti et al. 2006) and that only further observations revealed their true nature.
To conclude, J1824 is a promising tMSP candidate. To firmly establish its nature, new observations are needed. Observing the transition to the pulsar state would definitively classify J1824 as a tMSP. Optical monitoring is the most useful tool for achieving this goal. Detection of sharp transitions between the high and low brightness modes in X-rays or in the optical/UV would also be a unique marker of tMSPs.
When this work was in the final stage of preparation, a manuscript by Kyer et al. (2025) containing an independent multi-wavelength study of this source was accepted for publication. Using optical and X-ray data, the authors obtained results compatible with ours and also conclude that the properties of J1824 are consistent with the observed properties of the sub-luminous disk state of tMSPs.


In addition, we checked the interstellar absorption using the 3D–NH tool by Doroshenko (2024) and obtained NH < 4 × 1021 cm−2. This is compatible with the value used in the fitting procedure.
Acknowledgments
We thank the anonymous referee for useful comments. The work is based upon observations carried out at the Observatorio Astronómico Nacional on the Sierra San Pedro Mártir (OAN-SPM), Baja California, México. We thank the daytime and night support staff at the OAN-SPM for facilitating and helping obtain our observations. The authors are grateful to TUBITAK, the Space Research Institute, the Kazan Federal University, and the Academy of Sciences of Tatarstan for their partial support in using RTT-150 (the Russian–Turkish 1.5 m telescope in Antalya). This work has made use of data from the European Space Agency (ESA) mission Gaia (https://www.cosmos.esa.int/gaia), processed by the Gaia Data Processing and Analysis Consortium (DPAC, https://www.cosmos.esa.int/web/gaia/dpac/consortium). Funding for the DPAC has been provided by national institutions, in particular the institutions participating in the Gaia Multilateral Agreement. The Pan-STARRS1 Surveys (PS1) and the PS1 public science archive have been made possible through contributions by the Institute for Astronomy, the University of Hawaii, the Pan-STARRS Project Office, the Max-Planck Society and its participating institutes, the Max Planck Institute for Astronomy, Heidelberg and the Max Planck Institute for Extraterrestrial Physics, Garching, The Johns Hopkins University, Durham University, the University of Edinburgh, the Queen’s University Belfast, the Harvard-Smithsonian Center for Astrophysics, the Las Cumbres Observatory Global Telescope Network Incorporated, the National Central University of Taiwan, the Space Telescope Science Institute, the National Aeronautics and Space Administration under Grant No. NNX08AR22G issued through the Planetary Science Division of the NASA Science Mission Directorate, the National Science Foundation Grant No. AST-1238877, the University of Maryland, Eotvos Lorand University (ELTE), the Los Alamos National Laboratory, and the Gordon and Betty Moore Foundation. Based on observations obtained with the Samuel Oschin Telescope 48-inch and the 60-inch Telescope at the Palomar Observatory as part of the Zwicky Transient Facility project. ZTF is supported by the National Science Foundation under Grants No. AST-1440341 and AST-2034437 and a collaboration including current partners Caltech, IPAC, the Oskar Klein Center at Stockholm University, the University of Maryland, University of California, Berkeley , the University of Wisconsin at Milwaukee, University of Warwick, Ruhr University, Cornell University, Northwestern University and Drexel University. Operations are conducted by COO, IPAC, and UW. This work used data obtained with eROSITA telescope onboard SRG observatory. The SRG observatory was built by Roskosmos in the interests of the Russian Academy of Sciences represented by its Space Research Institute (IKI) in the framework of the Russian Federal Space Program, with the participation of the Deutsches Zentrum für Luft- und Raumfahrt (DLR). The SRG/eROSITA X-ray telescope was built by a consortium of German Institutes led by MPE, and supported by DLR. The SRG spacecraft was designed, built, launched and is operated by the Lavochkin Association and its subcontractors. The science data are downlinked via the Deep Space Network Antennae in Bear Lakes, Ussurijsk, and Baykonur, funded by Roskosmos. The eROSITA data used in this work were processed using the eSASS software system developed by the German eROSITA consortium and proprietary data reduction and analysis software developed by the Russian eROSITA Consortium. DAZ thanks Pirinem School of Theoretical Physics for hospitality. The work of DAZ, AVK and YAS (analysis of archival and OAN-SPM optical data and analysis of X-ray data) was supported by the baseline project FFUG-2024-0002 of the Ioffe Institute. AYK acknowledges the DGAPA-PAPIIT grant IA105024. The work of IFB, ENI, MAG, MVS was supported through subsidy FZSM-2023-0015 of the Ministry of Education and Science of the Russian Federation allocated to the Kazan Federal University for the State assignment in the sphere of scientific activities.
References
- Alpar, M. A., Cheng, A. F., Ruderman, M. A., & Shaham, J. 1982, Nature, 300, 728 [NASA ADS] [CrossRef] [Google Scholar]
- Archibald, A. M., Stairs, I. H., Ransom, S. M., et al. 2009, Science, 324, 1411 [Google Scholar]
- Arnaud, K. A. 1996, ASP Conf. Ser., 101, 17 [Google Scholar]
- Ballet, J., Bruel, P., Burnett, T. H., & Lott, B., & The Fermi-LAT Collaboration 2023, ArXiv e-prints [arXiv:2307.12546] [Google Scholar]
- Bailer-Jones, C. A. L., Rybizki, J., Fouesneau, M., Demleitner, M., & Andrae, R. 2021, AJ, 161, 147 [Google Scholar]
- Bassa, C. G., Patruno, A., Hessels, J. W. T., et al. 2014, MNRAS, 441, 1825 [Google Scholar]
- Bisnovatyi-Kogan, G. S., & Komberg, B. V. 1974, Sov. Astron., 18, 217 [NASA ADS] [Google Scholar]
- Bogdanov, S. 2016, ApJ, 826, 28 [NASA ADS] [CrossRef] [Google Scholar]
- Bogdanov, S., Deller, A. T., Miller-Jones, J. C. A., et al. 2018, ApJ, 856, 54 [NASA ADS] [CrossRef] [Google Scholar]
- Bond, H. E., White, R. L., Becker, R. H., & O’Brien, M. S. 2002, PASP, 114, 1359 [NASA ADS] [CrossRef] [Google Scholar]
- Cash, W. 1979, ApJ, 228, 939 [Google Scholar]
- Coti Zelati, F., Papitto, A., de Martino, D., et al. 2019, A&A, 622, A211 [NASA ADS] [CrossRef] [EDP Sciences] [Google Scholar]
- Covington, A. E., Shaw, A. W., Mukai, K., et al. 2022, ApJ, 928, 164 [NASA ADS] [CrossRef] [Google Scholar]
- Doroshenko, V. 2024, ArXiv e-prints [arXiv:2403.03127] [Google Scholar]
- Evans, P. A., Beardmore, A. P., Page, K. L., et al. 2009, MNRAS, 397, 1177 [Google Scholar]
- Evans, P. A., Page, K. L., Beardmore, A. P., et al. 2023, MNRAS, 518, 174 [Google Scholar]
- Finkbeiner, D. P., Padmanabhan, N., Schlegel, D. J., et al. 2004, AJ, 128, 2577 [Google Scholar]
- Flewelling, H. A., Magnier, E. A., Chambers, K. C., et al. 2020, ApJS, 251, 7 [NASA ADS] [CrossRef] [Google Scholar]
- Foight, D. R., Güver, T., Özel, F., & Slane, P. O. 2016, ApJ, 826, 66 [Google Scholar]
- Gaia Collaboration (Prusti, T., et al.) 2016, A&A, 595, A1 [NASA ADS] [CrossRef] [EDP Sciences] [Google Scholar]
- Gaia Collaboration (Vallenari, A., et al.) 2023, A&A, 674, A1 [NASA ADS] [CrossRef] [EDP Sciences] [Google Scholar]
- Galazutdinov, G. A. 2022, Astrophys. Bull., 77, 519 [Google Scholar]
- Green, G. M., Schlafly, E., Zucker, C., Speagle, J. S., & Finkbeiner, D. 2019, ApJ, 887, 93 [NASA ADS] [CrossRef] [Google Scholar]
- Kerby, S., Kaur, A., Falcone, A. D., et al. 2021, ApJ, 923, 75 [NASA ADS] [CrossRef] [Google Scholar]
- Kolbin, A. I., Karpova, A. V., Suslikov, M. V., et al. 2024, Astron. Lett., 50, 351 [Google Scholar]
- Kyer, R., Roy, S., Strader, J., et al. 2025, ApJ, 983, 112 [Google Scholar]
- Labrie, K., Simpson, C., Cardenes, R., et al. 2023, Res. Notes Am. Astron. Soc., 7, 214 [Google Scholar]
- Landolt, A. U. 1992, AJ, 104, 340 [Google Scholar]
- Lomb, N. R. 1976, Ap&SS, 39, 447 [Google Scholar]
- Martin, D. C., Fanson, J., Schiminovich, D., et al. 2005, ApJ, 619, L1 [Google Scholar]
- Masci, F. J., Laher, R. R., Rusholme, B., et al. 2019, PASP, 131, 018003 [Google Scholar]
- Masetti, N., Morelli, L., Palazzi, E., et al. 2006, A&A, 459, 21 [NASA ADS] [CrossRef] [EDP Sciences] [Google Scholar]
- Mason, P. A., & Santana, J. B. 2015, in The Golden Age of Cataclysmic Variables and Related Objects - III, 16 [Google Scholar]
- Mayer, M. G. F., & Becker, W. 2024, A&A, 684, A208 [NASA ADS] [CrossRef] [EDP Sciences] [Google Scholar]
- Meintjes, P. J., Madzime, S. T., Kaplan, Q., & van Heerden, H. J. 2023, Galaxies, 11, 14 [Google Scholar]
- Miller, J. M., Swihart, S. J., Strader, J., et al. 2020, ApJ, 904, 49 [NASA ADS] [CrossRef] [Google Scholar]
- Ness, J.-U. 2020, Adv. Space Res., 66, 1202 [NASA ADS] [CrossRef] [Google Scholar]
- Papitto, A., & de Martino, D. 2022, Astrophys. Space Sci. Libr., 465, 157 [NASA ADS] [CrossRef] [Google Scholar]
- Papitto, A., Ferrigno, C., Bozzo, E., et al. 2013, Nature, 501, 517 [NASA ADS] [CrossRef] [Google Scholar]
- Predehl, P., Andritschke, R., Arefiev, V., et al. 2021, A&A, 647, A1 [EDP Sciences] [Google Scholar]
- Roberts, M. S. E. 2013, IAU Symp., 291, 127 [NASA ADS] [Google Scholar]
- Rodriguez, A. C. 2024, PASP, 136, 054201 [NASA ADS] [CrossRef] [Google Scholar]
- Roy, J., Ray, P. S., Bhattacharyya, B., et al. 2015, ApJ, 800, L12 [Google Scholar]
- Salvetti, D., Mignani, R. P., De Luca, A., et al. 2017, MNRAS, 470, 466 [NASA ADS] [CrossRef] [Google Scholar]
- Scargle, J. D. 1982, ApJ, 263, 835 [Google Scholar]
- Sokolovsky, K. V., Li, K. L., Lopes de Oliveira, R., et al. 2022, MNRAS, 514, 2239 [Google Scholar]
- Sokolovsky, K. V., Johnson, T. J., Buson, S., et al. 2023, MNRAS, 521, 5453 [NASA ADS] [CrossRef] [Google Scholar]
- Strader, J., Li, K.-L., Chomiuk, L., et al. 2016, ApJ, 831, 89 [NASA ADS] [CrossRef] [Google Scholar]
- Strader, J., Swihart, S. J., Urquhart, R., et al. 2021, ApJ, 917, 69 [NASA ADS] [CrossRef] [Google Scholar]
- Sunyaev, R., Arefiev, V., Babyshkin, V., et al. 2021, A&A, 656, A132 [NASA ADS] [CrossRef] [EDP Sciences] [Google Scholar]
- Swihart, S. J., Strader, J., Chomiuk, L., et al. 2022, ApJ, 941, 199 [NASA ADS] [CrossRef] [Google Scholar]
- Tanaka, Y. 1997, in Accretion Disks - New Aspects, eds. E. Meyer-Hofmeister, & H. Spruit, 487, 1 [Google Scholar]
- Tody, D. 1986, SPIE, 627, 733 [Google Scholar]
- Tody, D. 1993, ASP Conf. Ser., 52, 173 [NASA ADS] [Google Scholar]
- Wegner, W. 2000, MNRAS, 319, 771 [Google Scholar]
- Wilms, J., Allen, A., & McCray, R. 2000, ApJ, 542, 914 [Google Scholar]
All Tables
Photometric observations of the likely counterpart to J1824 with the OAN-SPM 2.1 m, Maidanak 1.5 m, and RTT 150 telescopes.
Optical spectroscopic observations of the likely counterpart to J1824 with the RTT-150 telescope.
All Figures
|
Fig. 1. Images of the J1824 field. Left: 20′ × 20′ eROSITA image in the 0.3–2.3 keV range. The J1824 γ-ray position is marked by the cross, and the ellipse shows the 68% position uncertainty. The likely X-ray counterpart of J1824 is marked by the arrow. Right: 1′ × 1′ Pan-STARRS image in the r band. The circle shows the 98% position uncertainty of the X-ray source obtained with eROSITA. The likely optical counterpart is seen inside the circle. |
| In the text | |
|
Fig. 2. Optical light curves of the J1824 counterpart candidate based on data from the Pan-STARRS (PS) and ZTF catalogues in different filters (see the legend). |
| In the text | |
|
Fig. 3. Heliocentric light curves of the likely optical companion to J1824 obtained with the OAN-SPM (dots) and Maidanak (triangles) telescopes in the V band on different dates, as indicated in the panels. The dashed line shows the level of the possible stable state of the source (V = 20.0 mag), which is the median magnitude defined excluding flaring episodes. |
| In the text | |
|
Fig. 4. Heliocentric light curves of the likely optical companion to J1824 obtained with the RTT-150 (squares; top and bottom panels) and OAN-SPM (dots; middle panel) telescopes on different dates, as indicated in the panels. G-, B-, and R-band magnitudes are given in the Vega system, and the r-band magnitudes in the AB system. |
| In the text | |
|
Fig. 5. Unabsorbed optical spectra of the likely optical counterpart to J1824 obtained with RTT-150 on different dates. The positions of H and He lines are shown. |
| In the text | |
|
Fig. 6. Unabsorbed optical spectrum of the likely optical counterpart to J1824 obtained with the Gemini-North. Positions of H and He lines are shown. Zoomed-in regions around He I 7065 and Pa 11 lines are presented in the insets. The separations between the two peaks are marked. The best-fitting two-component Gaussian models are shown by the dashed red lines, and their components by the dashed green and orange lines. |
| In the text | |
|
Fig. 7. X-ray light curves of the likely counterpart to J1824 obtained with Swift/XRT and SRG/eROSITA. |
| In the text | |
|
Fig. 8. X-ray spectrum of the J1824 likely counterpart obtained with eROSITA and Swift, the best-fitting power-law model (top panel) and residuals (bottom panel). For illustrative purposes, the spectra were grouped to ensure at least three counts per bin. |
| In the text | |
|
Fig. 9. X-ray to γ-ray flux ratio vs X-ray photon index for tMSPs and tMSP candidates in the sub-luminous disk state (blue squares) and RBs or tMSPs in the pulsar regime (orange circles; adopted from Miller et al. 2020). The position of J1824 is shown by the magenta triangle. |
| In the text | |
Current usage metrics show cumulative count of Article Views (full-text article views including HTML views, PDF and ePub downloads, according to the available data) and Abstracts Views on Vision4Press platform.
Data correspond to usage on the plateform after 2015. The current usage metrics is available 48-96 hours after online publication and is updated daily on week days.
Initial download of the metrics may take a while.