Fig. 5
Download original image
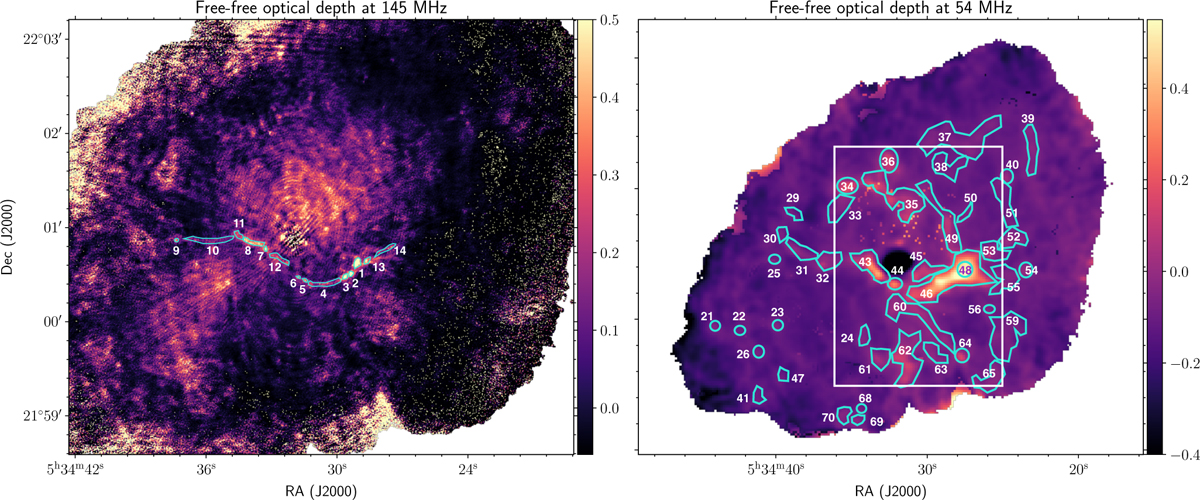
Left: best-fit free-free optical depth at 145 MHz. The integrated values for the regions labelled 1–14 are shown in Table 2. Right: best-fit free-free optical depth at 54 MHz. The integrated values for the regions labelled 21–70 are shown in Table 3. The region within the white box corresponds to the inset plotted in Fig. 7.
Current usage metrics show cumulative count of Article Views (full-text article views including HTML views, PDF and ePub downloads, according to the available data) and Abstracts Views on Vision4Press platform.
Data correspond to usage on the plateform after 2015. The current usage metrics is available 48-96 hours after online publication and is updated daily on week days.
Initial download of the metrics may take a while.