Fig. 3
Download original image
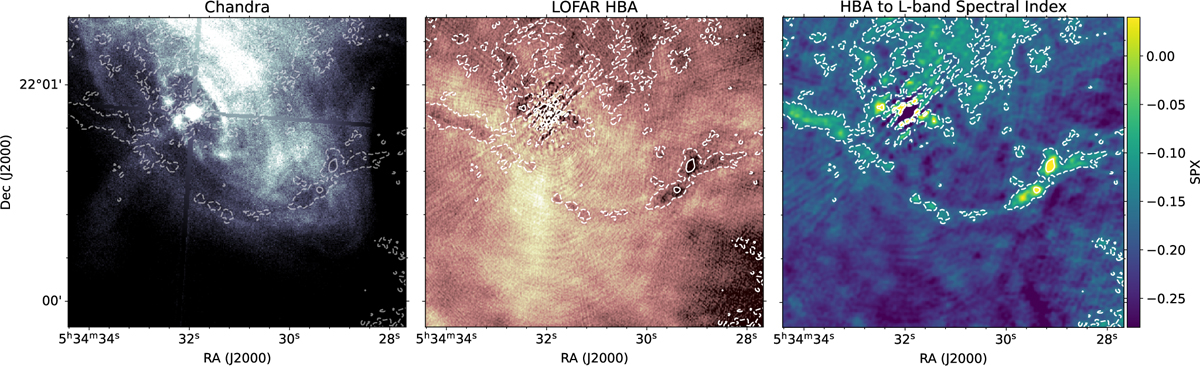
Cutout of the filament with a flat spectral index visible in the HBA to L band (145 MHz to 1.5 GHz) spectral index map (‘Filament 1’). On the left is the region as seen in the Chandra Low-Energy Transmission Grating with the High-Resolution Camera Spectroscopy detector (Weisskopf et al. 2012), in the middle as seen in the LOFAR HBA at 145 MHz, and in the right, the HBA to L band (145 MHz to 1.5 GHz) spectral index map (same as Fig. 2, right). The contours correspond to spectral index values of α = −0.15 and 0.05.
Current usage metrics show cumulative count of Article Views (full-text article views including HTML views, PDF and ePub downloads, according to the available data) and Abstracts Views on Vision4Press platform.
Data correspond to usage on the plateform after 2015. The current usage metrics is available 48-96 hours after online publication and is updated daily on week days.
Initial download of the metrics may take a while.