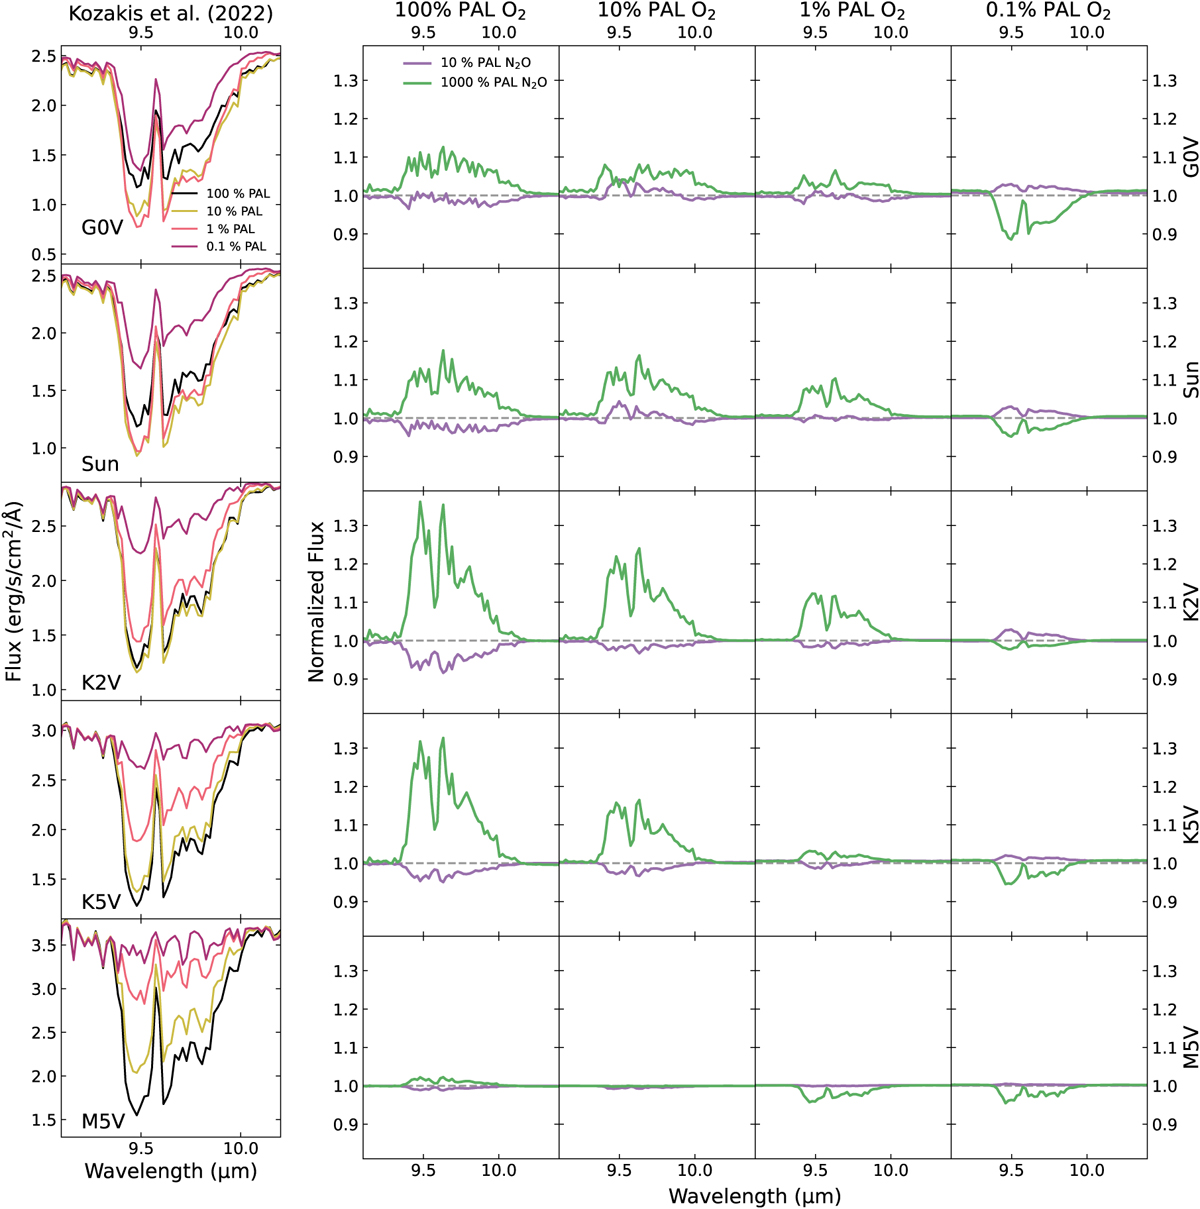
Fig. 7

Download original image
9.6 µm O3 feature for models from Kozakis et al. (2022) (left) and normalized models from varying N2O (right) from simulated planetary emission spectra. Changes in the O3 feature for this study depended primarily on changes in O3 abundance – rather than on changes in the atmospheric temperature profile, as in Kozakis et al. (2022) – since varying N2O often did not significantly impact the temperature profiles. As the K5V-hosted planet experienced the greatest change in O3 abundance with the high N2O models, it follows that its O3 emission spectral features were the most impacted. The M5V-hosted planet experienced the smallest change in O3 while varying N2O, which is reflected by the small variations in its O3 feature.
Current usage metrics show cumulative count of Article Views (full-text article views including HTML views, PDF and ePub downloads, according to the available data) and Abstracts Views on Vision4Press platform.
Data correspond to usage on the plateform after 2015. The current usage metrics is available 48-96 hours after online publication and is updated daily on week days.
Initial download of the metrics may take a while.


