Fig. 2
Download original image
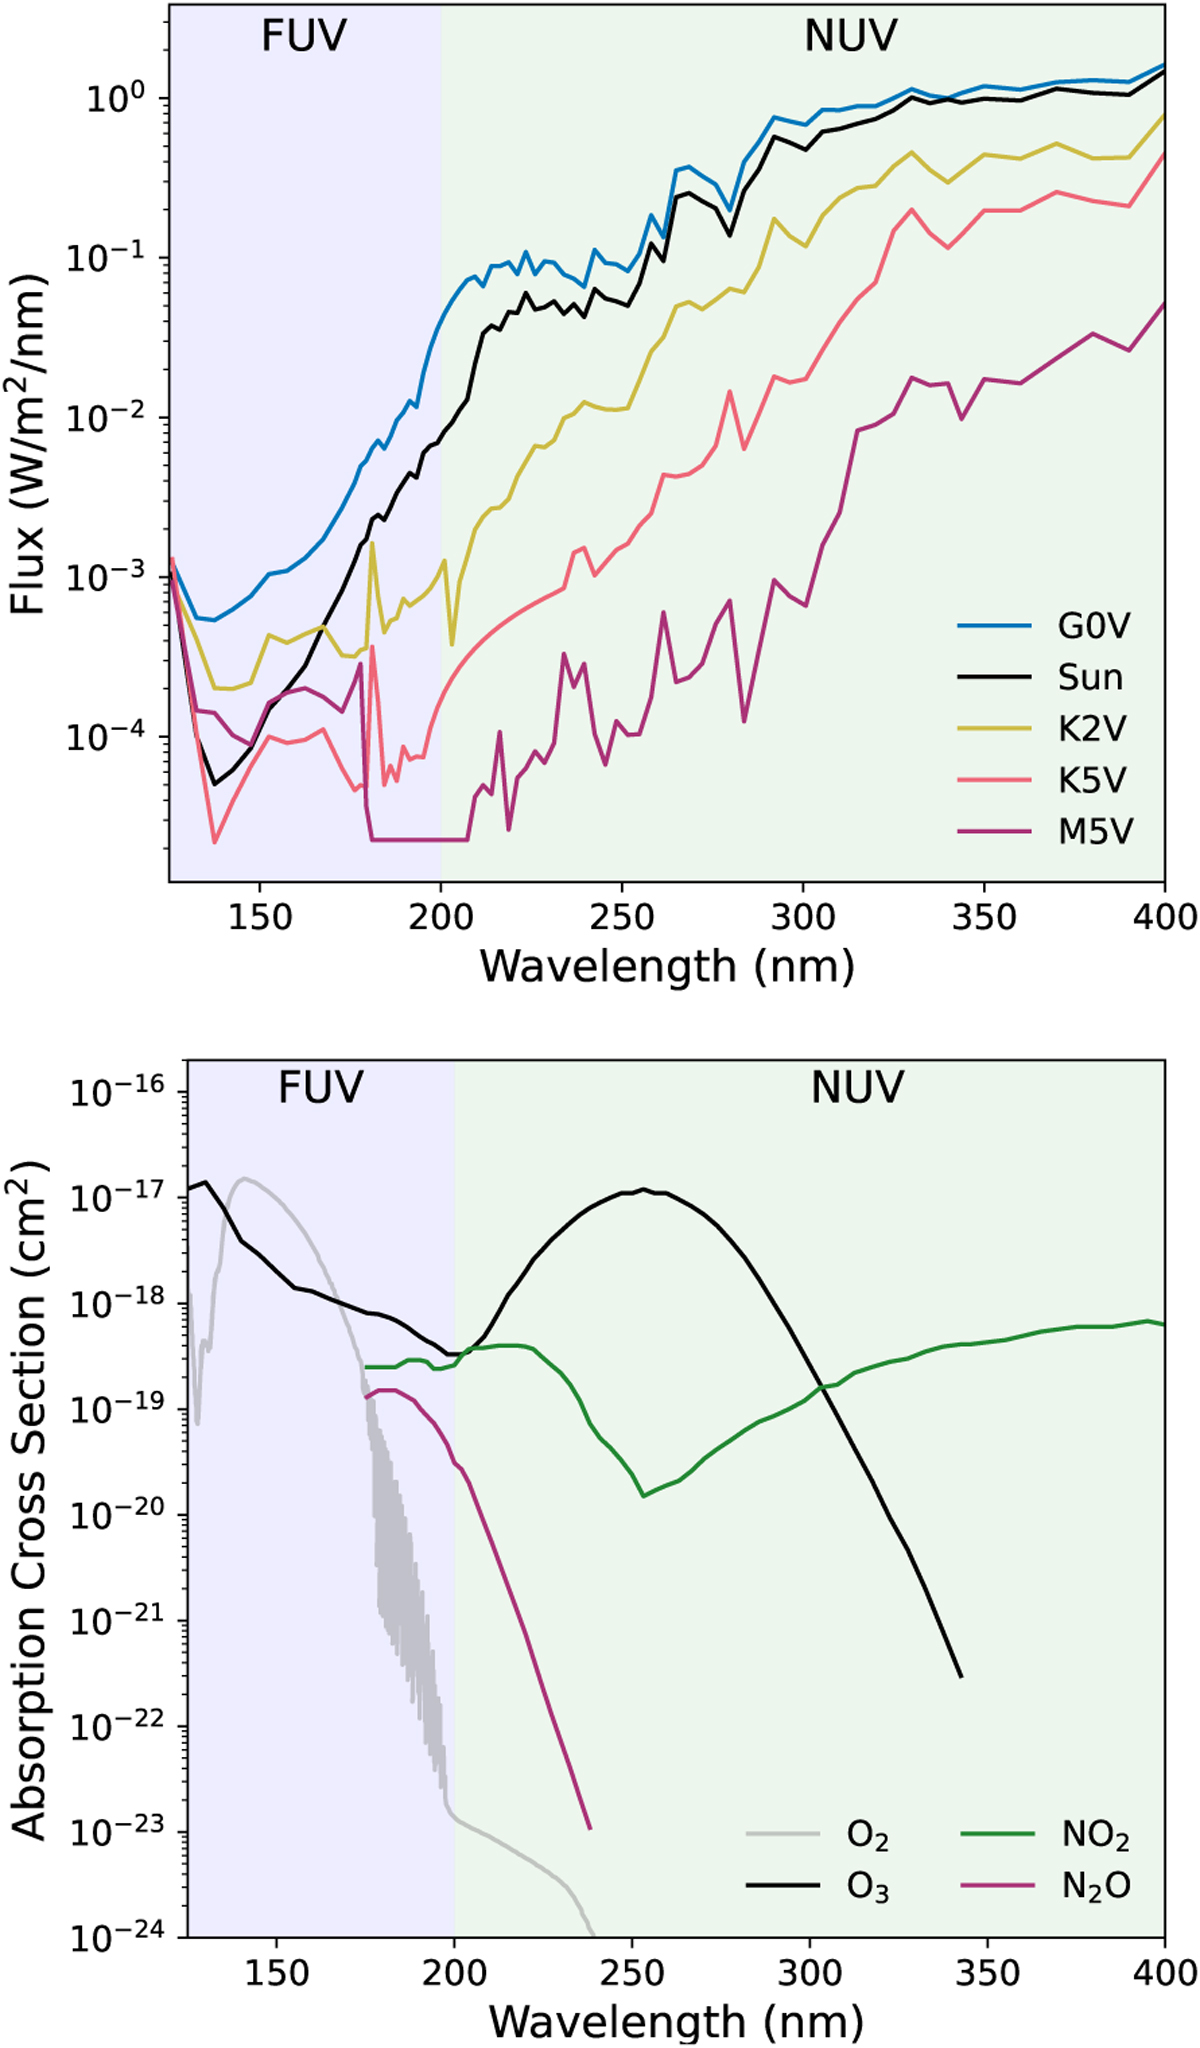
UV stellar spectra of the host stars in this study (top) and corresponding absorption cross sections of relevant gaseous species (bottom). The two plots cover the same wavelength range in order to facilitate comparisons. Cross sections for NO2 and N2O are cut off at shorter wavelengths, due to the dominance of absorption from CO2 and other atmospheric species.
Current usage metrics show cumulative count of Article Views (full-text article views including HTML views, PDF and ePub downloads, according to the available data) and Abstracts Views on Vision4Press platform.
Data correspond to usage on the plateform after 2015. The current usage metrics is available 48-96 hours after online publication and is updated daily on week days.
Initial download of the metrics may take a while.