Fig. 8.
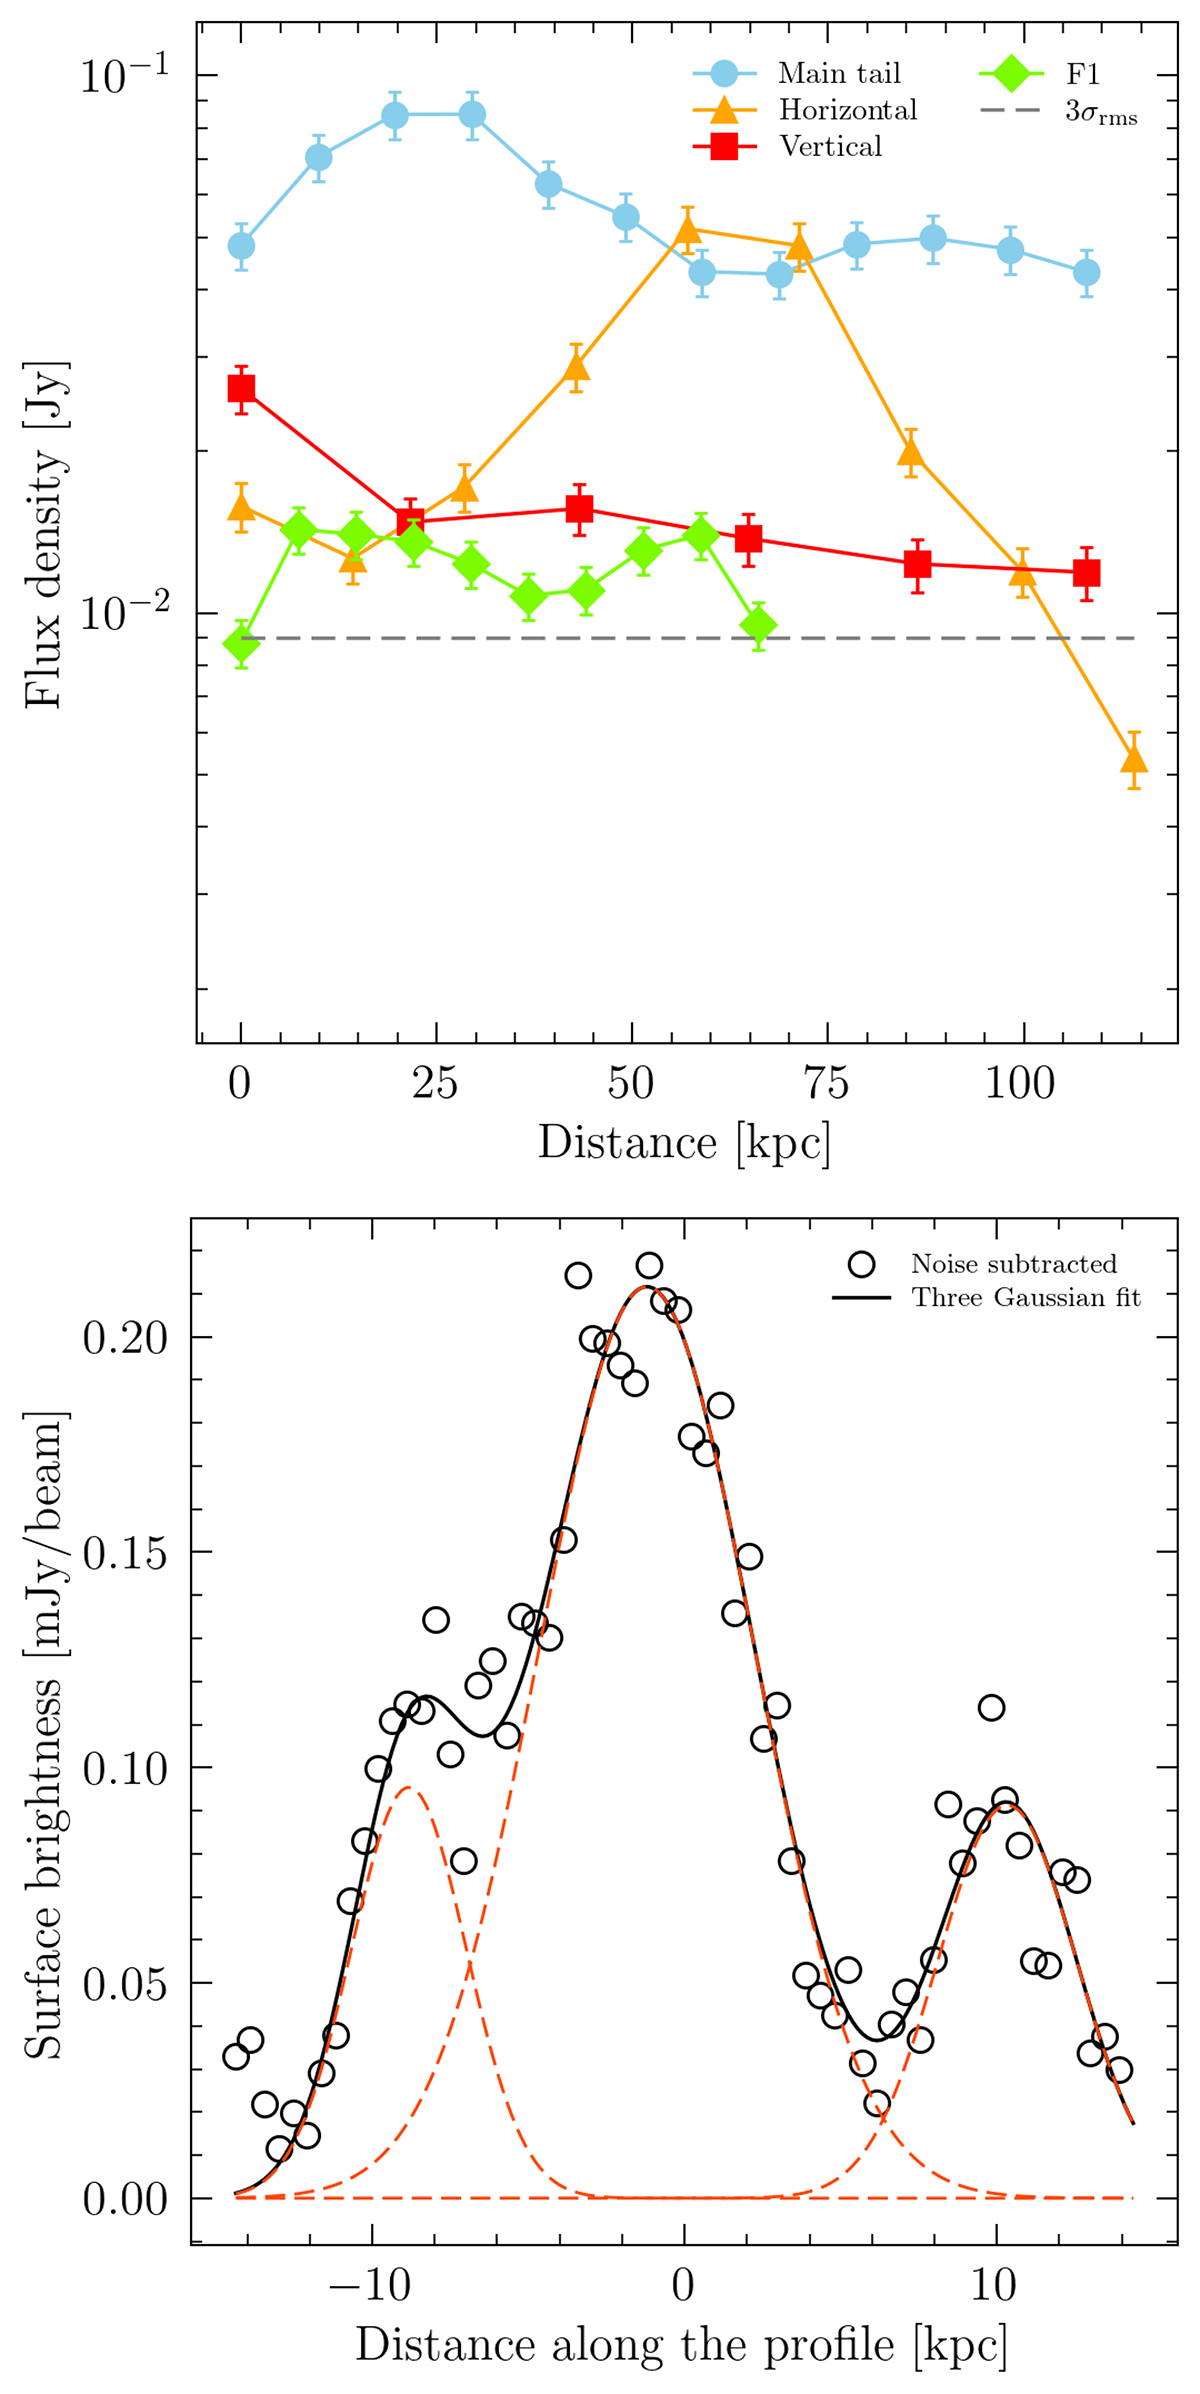
Download original image
Spatial trends along the Original TRG and its filaments from regions highlighted in Fig. 7. Top: Flux density along the main features of the Original TRG, highlighted in different colors. Error bars refer to the errors on flux densities, calculated assuming a 10% flux uncertainty (as for the LoTSS, Shimwell et al. 2022). Colored arrows indicate the direction followed by the spatial trends. Bottom: Profile across the Original TRG following the cut depicted in Fig. 7. The noise-subtracted data are shown as open circles. The black solid line shows the total fit using three-Gaussian fit. The three Gaussians (individually shown with red dashed lines) correspond (from left to right) to F1, the main tail, and F2, respectively.
Current usage metrics show cumulative count of Article Views (full-text article views including HTML views, PDF and ePub downloads, according to the available data) and Abstracts Views on Vision4Press platform.
Data correspond to usage on the plateform after 2015. The current usage metrics is available 48-96 hours after online publication and is updated daily on week days.
Initial download of the metrics may take a while.