Open Access
Fig. 7.
Download original image
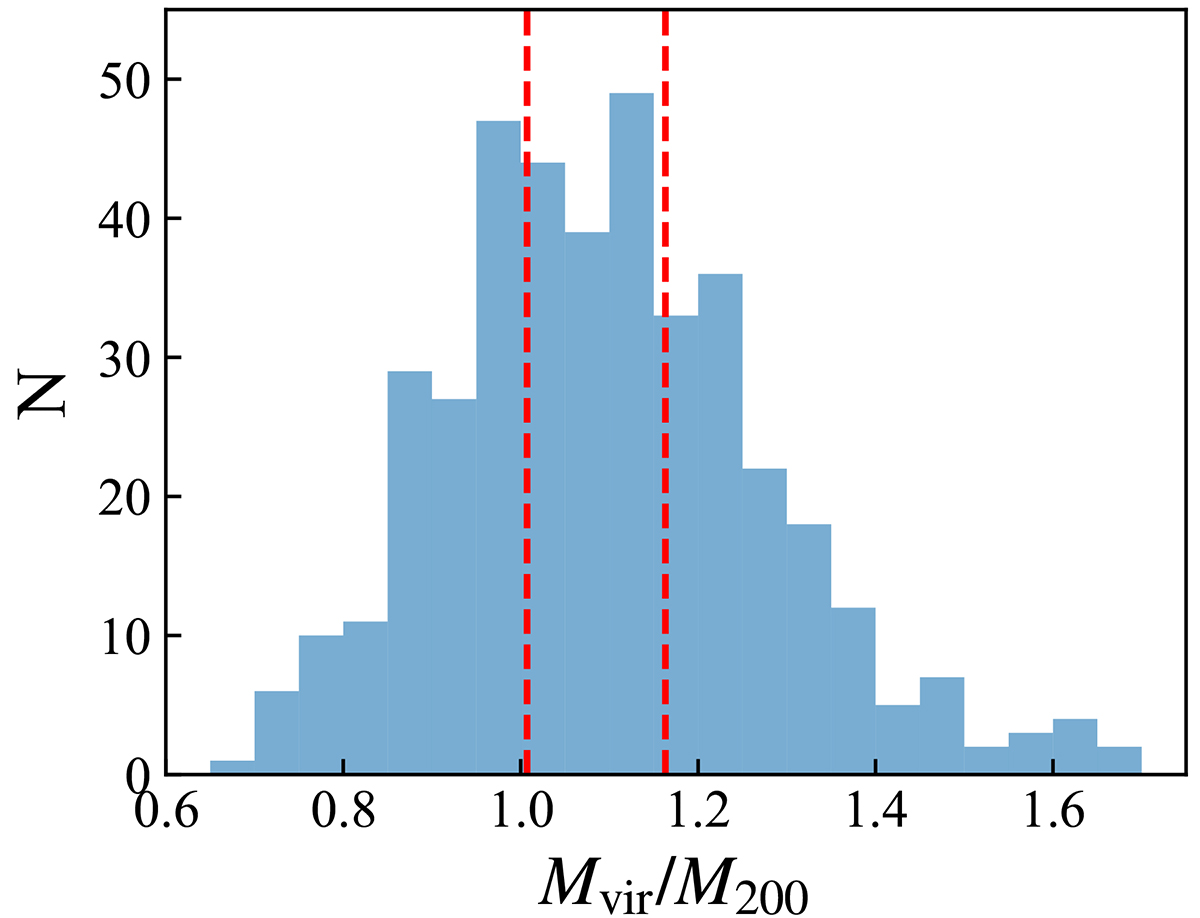
Mvir/M200 distribution of 408 clusters. The vertical dashed lines represent the criteria for dividing clusters into three equally sized sub-samples.
Current usage metrics show cumulative count of Article Views (full-text article views including HTML views, PDF and ePub downloads, according to the available data) and Abstracts Views on Vision4Press platform.
Data correspond to usage on the plateform after 2015. The current usage metrics is available 48-96 hours after online publication and is updated daily on week days.
Initial download of the metrics may take a while.