Fig. 6.
Download original image
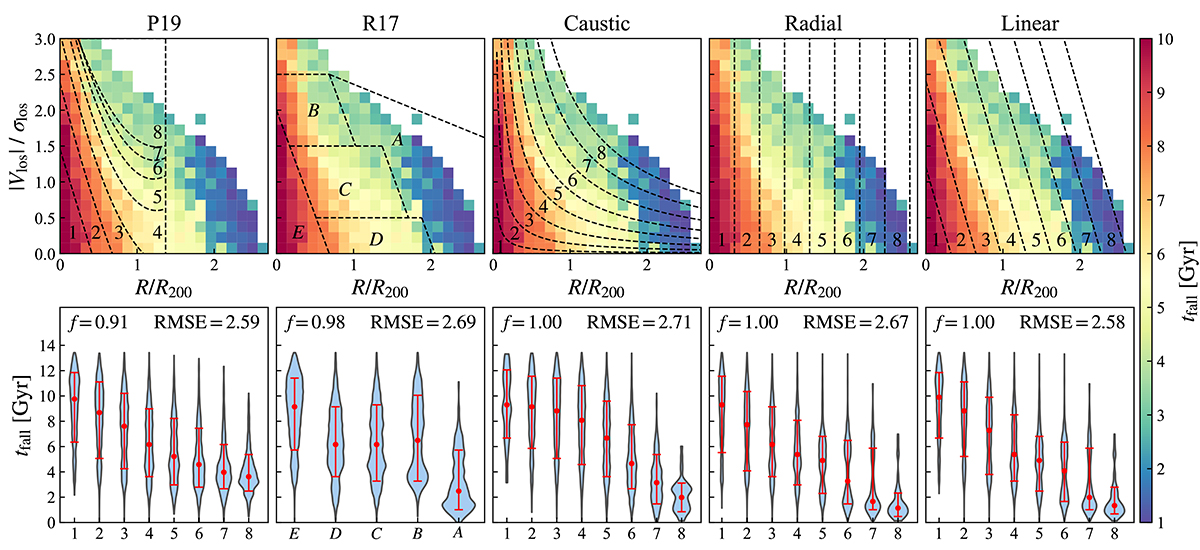
Top: Reference curves for each method plotted over the median tfall distribution in the R − V diagram. Bottom: tfall distributions of individual zones. The red dots represent the medians, and the error bars represent the 16th and 84th percentiles. The overall RMSE values relative to the zone medians are written in the upper right corners. The fraction of galaxies covered by each method is written in the upper left corner of the corresponding panel.
Current usage metrics show cumulative count of Article Views (full-text article views including HTML views, PDF and ePub downloads, according to the available data) and Abstracts Views on Vision4Press platform.
Data correspond to usage on the plateform after 2015. The current usage metrics is available 48-96 hours after online publication and is updated daily on week days.
Initial download of the metrics may take a while.