Fig. 5.
Download original image
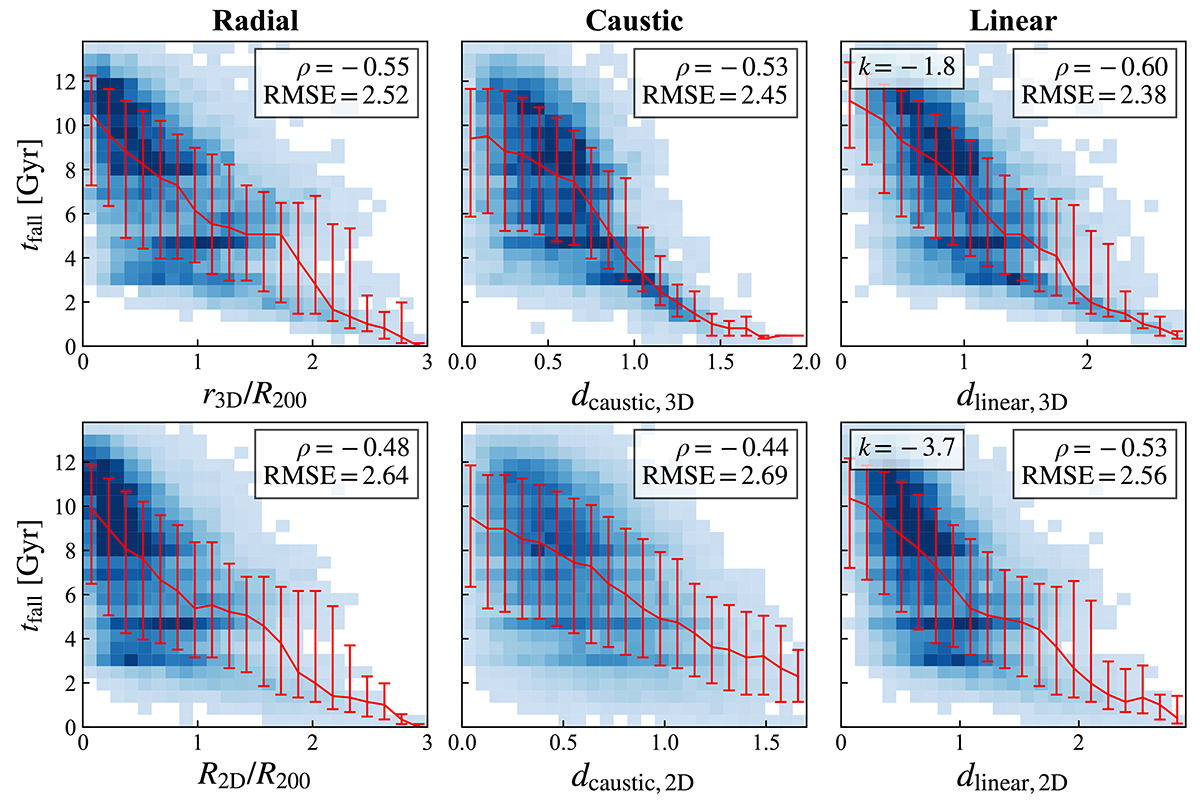
Relationships between tfall and the three tracers. The red curves indicate the median tfall in 20 bins, with error bars indicating the 16th and 84th percentiles. The Spearman coefficient, ρ, between tfall and each tracer is written in the corresponding upper right legend, together with the overall RMSE relative to the bin median. The slopes for calculating dlinear are given in the upper left corners.
Current usage metrics show cumulative count of Article Views (full-text article views including HTML views, PDF and ePub downloads, according to the available data) and Abstracts Views on Vision4Press platform.
Data correspond to usage on the plateform after 2015. The current usage metrics is available 48-96 hours after online publication and is updated daily on week days.
Initial download of the metrics may take a while.